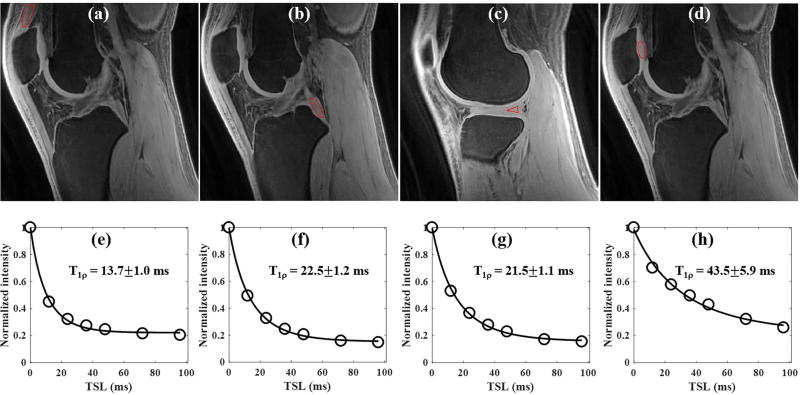
Figure 6.
3D AdiabT1ρ UTE-Cones imaging of an in vivo healthy knee (23 year old male volunteer). Representative AdiabT1ρ images with regions of interest (red circles) and corresponding fitting curves of quadriceps tendon, PCL, meniscus and patellar cartilage are shown in the first and second rows, respectively. The T1ρ values of quadriceps tendon, PCL, meniscus and patellar cartilage were 13.7±1.0, 22.5±1.2, 21.5±1.1 and 43.5±5.9 ms, respectively.

