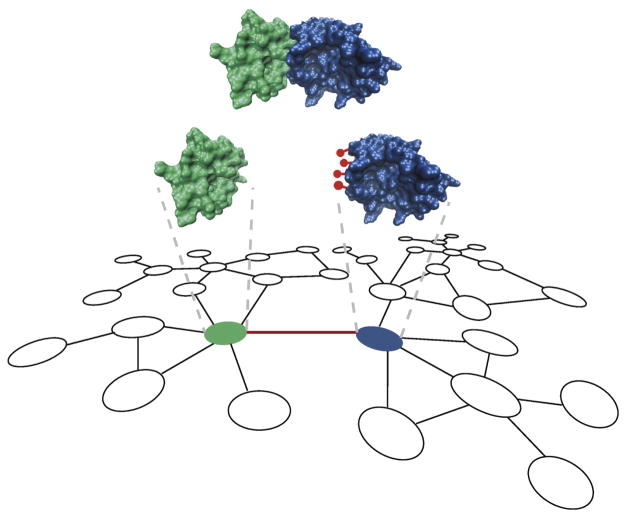
Figure 4.
A network-based approach for integration of protein-protein interaction networks with protein 3D structures and mutation data to identify cancer driver genes. Nodes represent proteins and edges represent interactions between proteins in the network. Unexpected mutational enrichment (red lollipops) on the interaction interface region of a protein (blue) implicates the encoding gene as potential cancer driver.

