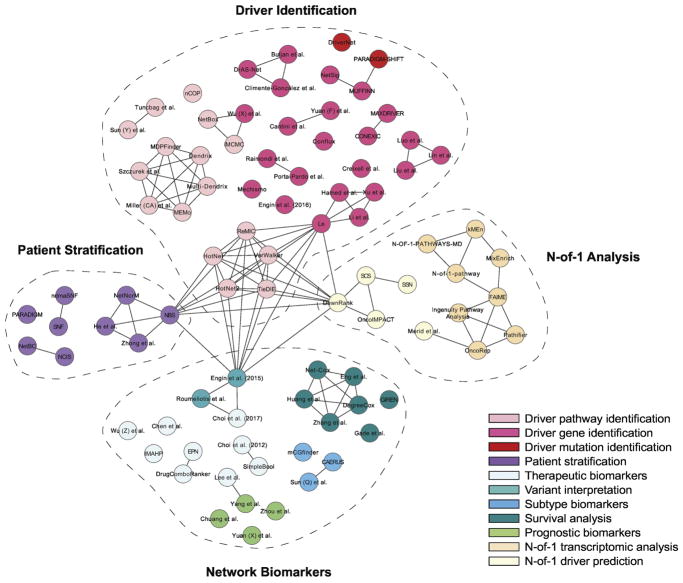
Figure 5.
Network of network-based methods used in cancer. Nodes represent the name of the methods and edges represent similarity in the utilized algorithmic approaches. The colors of nodes represent the application of the method. Similar applications are grouped together (dashed line) under four main categories: driver identification for pathways, genes (or miRNAs or alternative splicing) or mutations, patient stratification, network biomarkers (therapeutic biomarkers, variant interpretation, subtype biomarkers, survival analysis, prognostic biomarkers) and N-of-1 analysis including transcriptomic analysis and driver prediction.

