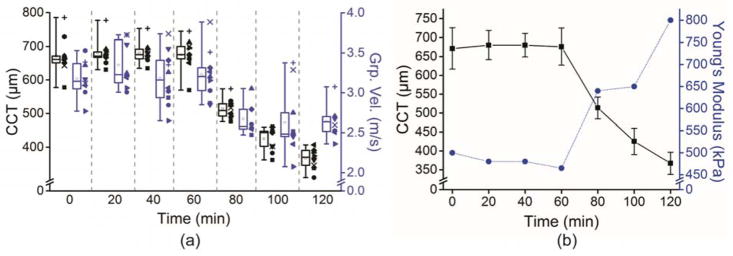
Figure 4.
a: The CCT and elastic-wave group velocity of all 10 samples plotted as a function of time. The CCT is represented in black, and the elastic-wave group velocity is represented in blue. Each sample is coded by the shape of the datapoints plotted alongside the corresponding box-and-whisker plot. The boxes are the interquartile range, the central line is the median, the whiskers are the 5th and 95th percentiles, and the small inscribed box is the mean. b: Averaged CCT and Young’s modulus quantified by the finite element method. The CCT is represented by the black squares and solid black line, and the Young’s modulus is represented by the blue circles and dotted blue line. The error bars are the intersample SD. A 0.9% PBS solution was dropped on the corneas for the first 60 minutes, and a 20% dextran solution was dropped on the corneas for an additional 60 minutes (CCT = central corneal thickness; Grp. Vel. = group velocity; PBS = phosphate-buffered saline).

