
Figure 4. Genetic variants that affect chromatin states in human T cell activation.
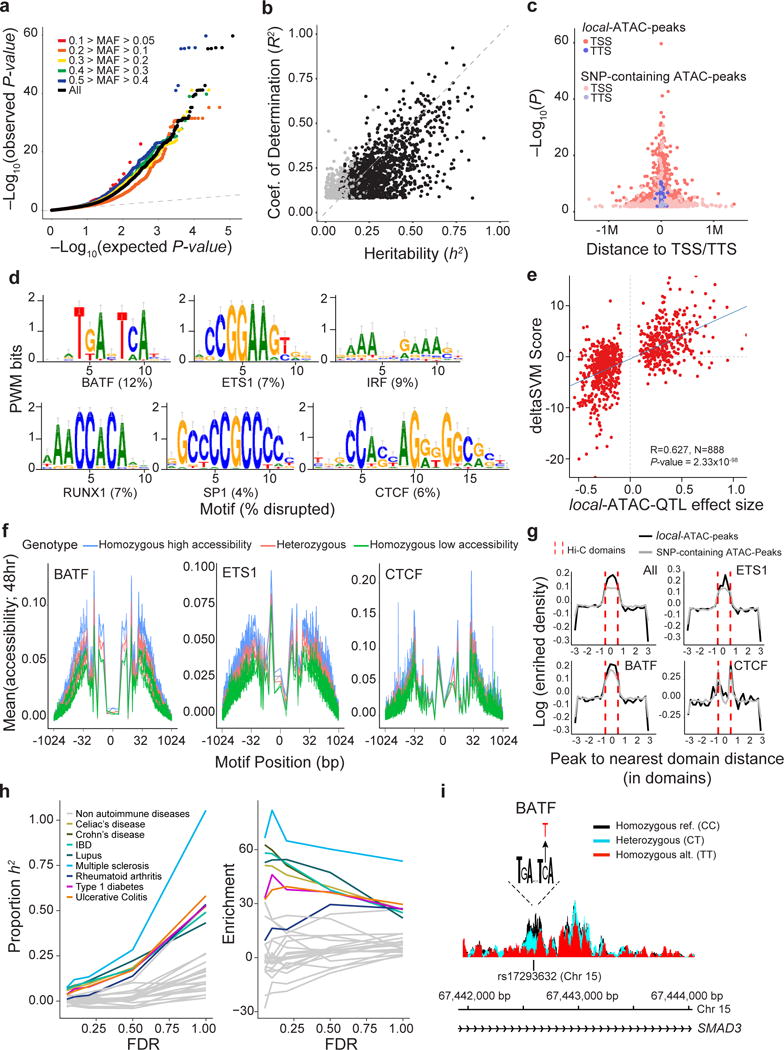
(a) Q-Q plot of linear regression P-values for all local-ATAC-QTLs (black) and local-ATAC-QTLs binned by minor allele frequency: 0.1 > MAF > 0.05 (red), 0.2 > MAF > 0.1 (orange), 0.3 > MAF 0.2 (yellow), 0.4 > MAF > 0.3 (green), 0.5 > MAF 0.4 (blue), and MAF > 0.05 (black). (b) Heritability of chromatin accessibility. For each of 1,428 local-ATAC-peaks, coefficient of determination (R2) of the best associated local-ATAC-QTL (y-axis) vs. cis heritability (h2) estimated based on all genotypes +/− 500 kb of each peak (x-axis). Black points: significantly heritable peaks (FDR < 0.05). (c) Enrichment of local-ATAC-peaks in TSS and TTS. 3,318 local-ATAC-peaks (dark pink and purple) vs. 3,318 randomly sampled SNP-containing ATAC-peaks (light pink and purple). (d-f) Disruption of TF binding sites by local-ATAC-QTLs. (d) Unsupervised TF binding site analysis of local-ATAC-peaks. Motifs for six TFs associated with most of the large gkmSVM weights, and the percentage of the overall disruption (%, bottom) explained by local-ATAC-QTLs. (e) Correlation of effect sizes of local-ATAC-QTLs (x-axis) vs. deltaSVM scores (y-axis). (f) Allele specificity of local-ATAC-QTLs. For BATF, ETS1 and CTCF motifs (as identified in ENCODE63), aggregated plots of mean chromatin accessibility (y-axis) of local-ATAC-peaks along the TF binding site (x-axis; log(bp from center of the TF motif)) for samples heterozygous (pink), homozygous for the high (blue) or low (green) local-ATAC-QTL alleles (g) Relation between contact domains and SNP-containing ATAC-peaks or local-ATAC-peaks. For ATAC-peaks or local-ATAC-peaks overlapping ETS1, CTCF, or BATF binding sites, enrichment density (y-axis) vs. distance (number of domains) of peak to nearest domain (x-axis). Hi-C contact domain boundaries are indicated (dotted red lines). (h) Partitioned heritability estimates. The proportion of the heritability for 28 diseases explained (proportion: left, y-axis; enrichment: right, y-axis) captured by local-ATAC-QTLs called at different FDR thresholds (x-axis). (i) Effects of local-ATAC-QTL rs17293632 on the accessibility of the corresponding BATF containing local-ATAC-peak on chromosome 15. ATAC-seq profiles were aggregated per rs17293632 genotypes (black: homozygous major allele, light blue: heterozygous, red: homozygous minor allele).