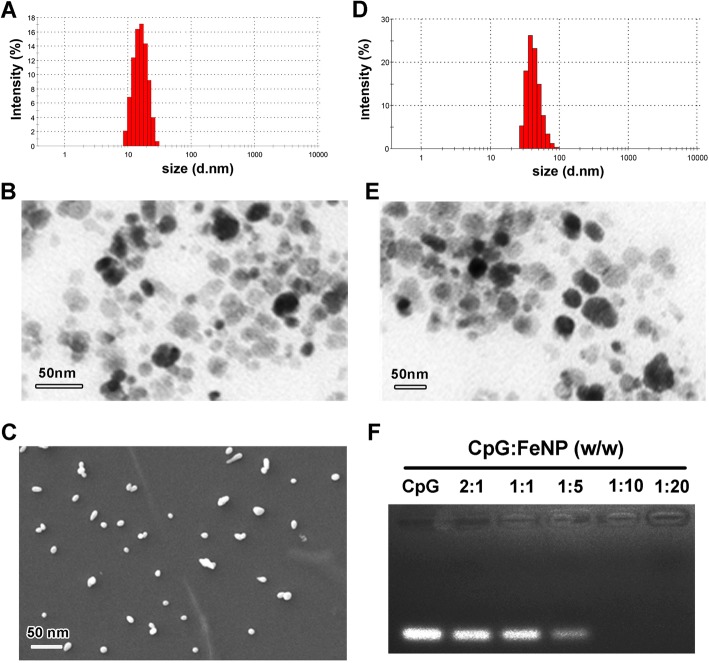
Fig. 2.
Characterization of FeNP/CpG particles. a Size distribution spectrum of Fe3O4 particles. b Transmission electron microscopic image (TEM) of Fe3O4. c Scanning electron microscopy image of Fe3O4 particles. d Size distribution of APTES-coated Fe3O4 (FeNP) particles. e The TEM image of FeNP particles. f The CpG binding ability of FeNPs determined by gel retardation assay. All data represent three independent experiments

