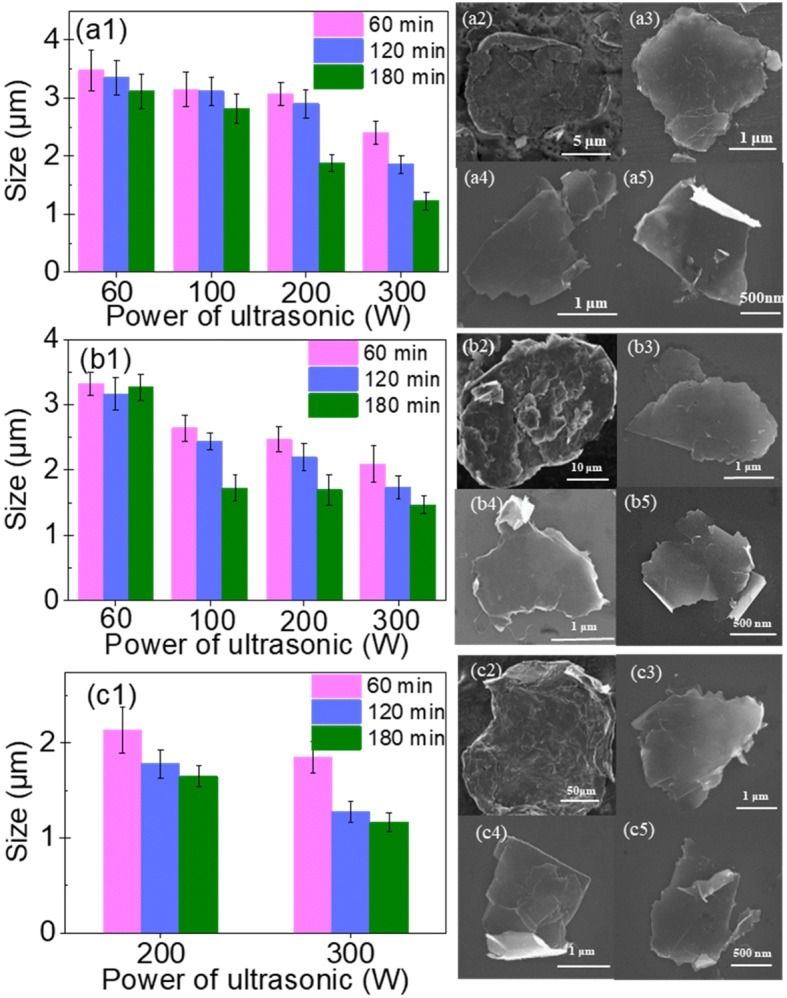
Fig. 3.

Mean size of GNPs produced using different sonication powers and times to exfoliate (a1) G10, (b1) G30, and (c1) G100 flaked graphite samples. SEM images of the flaked graphite samples (a2) G10, (b2) G30, and (c2) G100. SEM images of the GNPs produced by exfoliating G10 at a sonication power of 300 W for (a3) 60 min, (a4) 120 min, and (a5) 180 min. SEM images of the GNPs produced by exfoliating G30 at a sonication power of 300 W for (b3) 60 min, (b4) 120 min, and (b5) 180 min. SEM images of the GNPs produced by exfoliating G100 at a sonication power of 300 W for (c3) 60 min, (c4) 120 min, and (c5) 180 min
