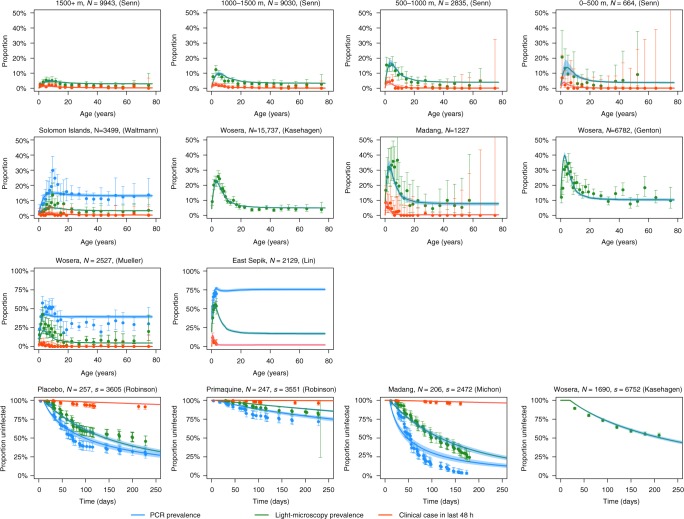
Fig. 1.
Calibration of model to cross-sectional and longitudinal surveys from PNG and the Solomon Islands. For the cross-sectional surveys, the data are presented as age-stratified estimates of prevalence with 95% confidence intervals. The same definition of clinical malaria was used in all cross-sectional surveys: high density parasitaemia and fever (≥38 °C) in the last 48 h. The number of individuals in each cross-section is denoted N. For the longitudinal surveys in the bottom row, the data are presented as Kaplan–Meier estimates of proportion infected with 95% confidence intervals. The number of individuals included in longitudinal follow-up is denoted N and the total number of samples denoted s. The solid curves show the posterior median model prediction, and the shaded regions denote the 95% credible intervals

