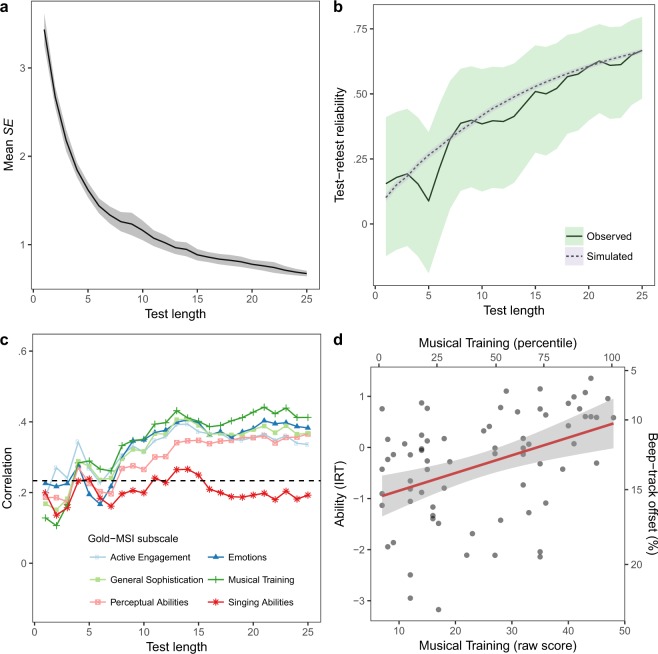
Figure 4.
Study 3 (laboratory testing) results. The test displays good reliability (mean SE and test-retest reliability) and nomothetic span (correlations with related measures). (a) Mean standard error (SE) of CA-BAT ability estimates plotted as a function of test length. The shaded ribbon marks the 95% confidence region. (b) Test-retest reliability (Pearson correlation) plotted as a function of test length. The shaded ribbons mark 95% confidence regions. (c) Correlations between CA-BAT ability estimates (Wave 1) and sub-scales of the Gold-MSI self-report questionnaire, plotted as a function of test length. The dotted line marks the threshold for two-tailed statistical significance at a level of . (d) CA-BAT performance (Wave 1, after 25 items) as a function of Musical Training scores from the Gold-MSI self-report questionnaire. A least-squares regression line is plotted with the standard error of its predictions shaded in grey. Musical Training raw scores are mapped to population percentiles reported in the original Gold-MSI study6. CA-BAT performance is represented both as ability estimates and as corresponding beep-track offsets for ‘ahead-of-the-beat’ items.

