Fig. 5.
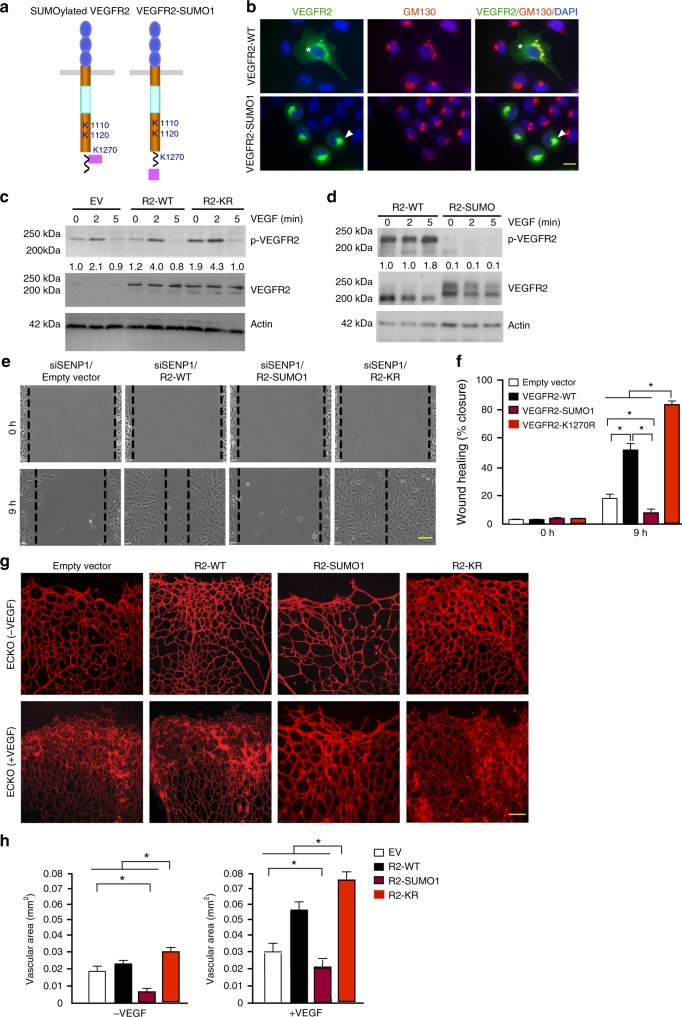
SUMOylation of VEGFR2 blocks VEGFR2 surface targeting and VEGFR2-mediated angiogenesis. a Schematic diagram of VEGFR2-SUMO1 fusion compared to endogenous SUMOylated VEGFR2. b HUVECs were transfected with VEGFR2-WT or VEGFR2-SUMO1, and cells were co-immunostained with anti-VEGFR2 and GM130. Merged images with DAPI counterstaining (blue) are shown. A total of 10 cells from each group were analyzed. Golgi-accumulated VEGFR2 is indicated by arrows while membrane/cytosolic VEGFR2 by asterisks. c, d HUVECs were infected with lentivirus expressing empty vector (EV), VEGFR2-WT, VEGFR2-KR or VEGFR2-SUMO1 followed by VEGF treatment as indicated. Phosphor- and total VEGFR2 were examined by western blotting. Protein bands were quantified by densitometry and fold changes are presented by taking untreated VEGFR2-WT group as 1.0. n = 2. e, f HUVEC were infected with lentivirus expressing empty vector, VEGFR2-WT, VEGFR2-SUMO1 and VEGFR2-K1270R for 24 h. Cells were cultured in 0.5% FBS for overnight and subjected to EC migration in response to VEGF (10 ng/ml). Representative images are presented in (e) and wound healing (% closure) at 9 h was quantified in (f). Data are mean ± SEM from ten fields per group. Three independent experiments were performed. g, h VEGFR2-SUMO1 blunts retina angiogenesis. Ad-VEGF or Ad-LacZ (1 × 10⁹ pfu) was co-injected intravetrously with VEGFR2-WT, VEGFR2-SUMO1 or VEGFR2-K1270R into 4 day-old pups. Retina was harvested on day 5 post-injection and retina vasculature was visualized by isolectin staining with confocal images in (g) with quantification of vessel density in (h). n = 5 for each group. Error bars, mean ± SEM; ∗P < 0.05, one-way ANOVA. Scale bar, 20 μm (b); 1 mm (e); 100 μm (g)

