Figure 1.
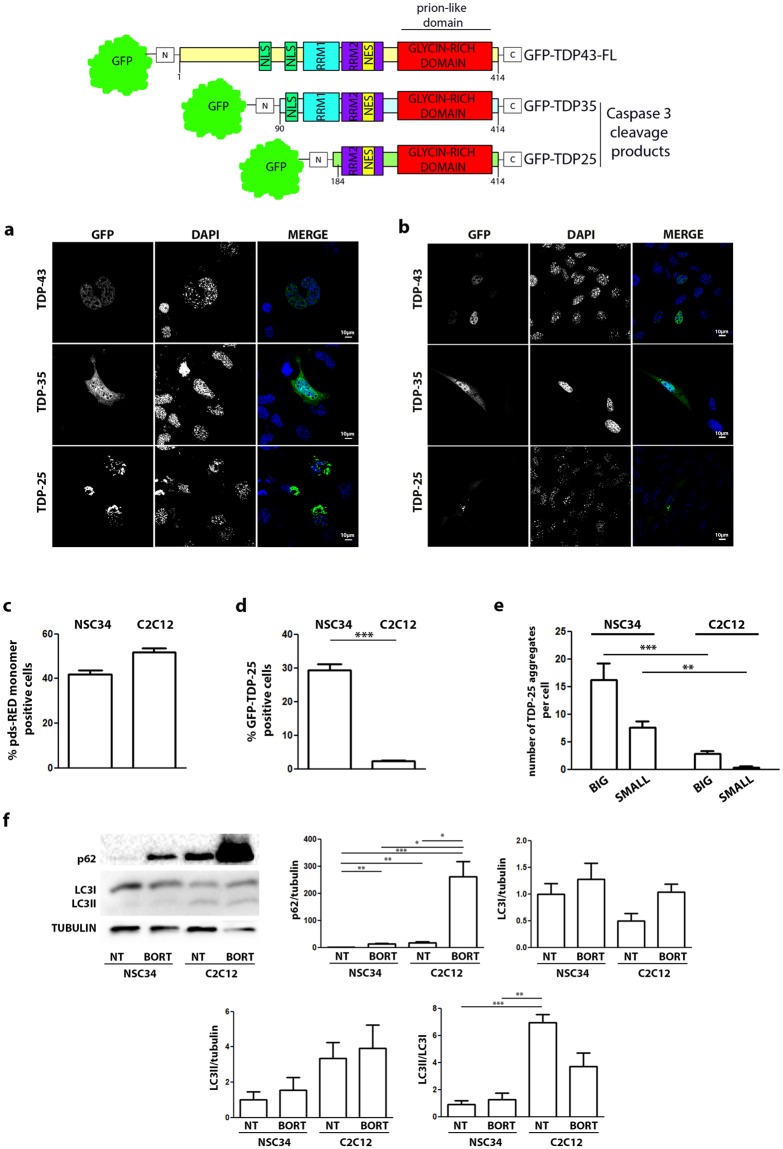
TDP-43 variants show different behavior in NSC34 and C2C12 cells. (Upper Panel) schematic representation of TDPs variants used in this study. (a,b) Confocal microscope analyses. NSC34 (a) or C2C12 (b) cells were transiently transfected with GFP-TDP-43, GFP-TDP-35, GFP-TDP-25 plasmids. Nuclei were stained with DAPI. Images were acquired using confocal microscope with 63X magnification. (c,d) Fluorescent flow cytometry analysis. NSC34 and C2C12 were transiently transfected with pDS-RED-monomer and GFP-TDP-25: (c) percentage of cells displaying red fluorescence and (d) percentage of red fluorescent cells displaying green fluorescence. (e) Aggregates count. NSC34 and C2C12 were transiently transfected with GFP-TDP-43, GFP-TDP-35, GFP-TDP-25. Big aggregates: dots composed of more than 1,000,000 pixels. Small aggregates: dots composed of less than 1,000,000 pixels. (f) Degradative systems activation in NSC34 and C2C12. NSC34 and C2C12 were treated with Bortezomib 200 nM. WB (15% polyacrilamide gel) shows p62, LC3I and LC3II levels. Graphics show quantification of p62 protein levels normalized on tubulin, quantification of LC3I protein levels normalized on tubulin, quantification of LC3II protein levels normalized on tubulin, LC3II/LC3I ratio (full-length blots/gels are presented in Supplementary Figure S4).

