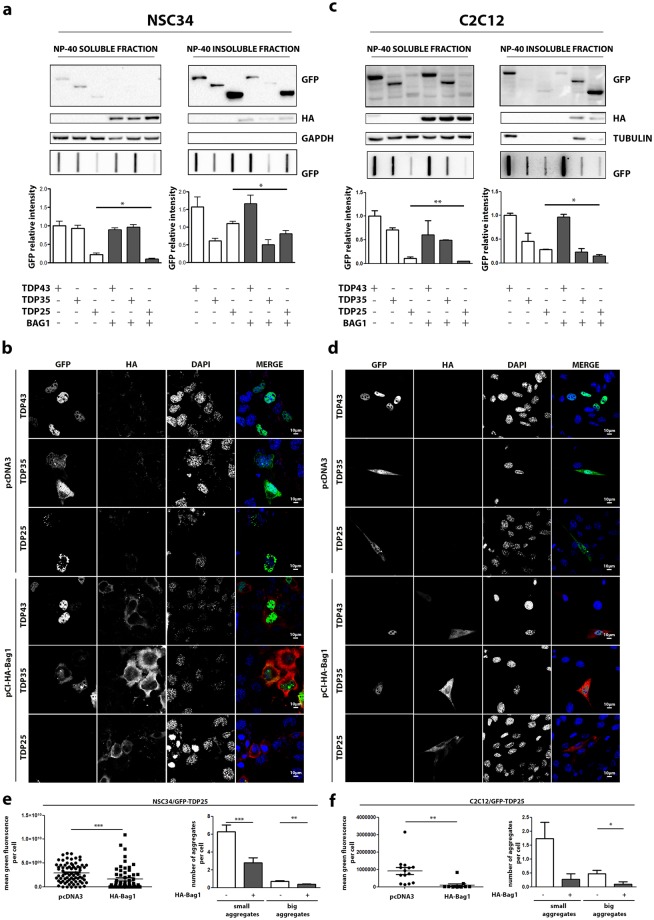
Figure 5.
Proteasome re-routing is beneficial to GFP-TDP-25 aggregation. (a) NSC34 overexpressing GFP-TDPs, and co-transfected with pCI-HA-Bag1 or pcDNA3. Left panel: NP-40 soluble extracts WB analysis (upper inset, 12% polyacrylamide gels), NP-40 soluble extracts FRA analysis (middle inset) and quantification of NP-40 soluble extracts FRA analysis (*p < 0.05 vs GFP-TDP-25 co-transfected with pcDNA3) (lower inset). Right panel: NP-40 insoluble extracts WB analysis (upper inset, 12% polyacrylamide gels), NP-40 insoluble extracts FRA analysis (middle inset) and quantification of NP-40 insoluble extracts FRA analysis (*p < 0.05 vs GFP-TDP-25 co-transfected with pcDNA3) (lower inset). (b) NSC34 overexpressing GFP-TDPs, and co-transfected with pCI-HA-Bag1 or pcDNA3 analysed with confocal microscope. 63X magnification. Green: GFP-TDPs; Red: hBag1; nuclei: DAPI. (c) C2C12 overexpressing GFP-TDPs, and co-transfected with pCI-HA-Bag1 or pcDNA3. Left panel: NP-40 soluble extracts WB analysis (upper inset, 12% polyacrylamide gels), NP-40 soluble extracts FRA analysis (middle inset) and quantification of NP-40 soluble extracts FRA analysis (**p < 0.05 vs GFP-TDP-35 co-transfected with pcDNA3) (lower inset). Right panel: NP-40 insoluble extracts WB analysis (upper inset, 12% polyacrylamide gels), NP-40 insoluble extracts FRA analysis (middle inset) and quantification of NP-40 insoluble extracts FRA analysis (*p < 0.05 vs GFP-TDP-25 co-transfected with pcDNA3). (d) C2C12 overexpressing GFP-TDPs, and co-transfected with pCI-HA-Bag1 or pcDNA3 as control vector analysed with confocal microscope. 63X magnification. Green: GFP-TDPs; Red: hBag1; nuclei: DAPI. (e) Microscope analysis of NSC34 transiently co-transfected with GFP-TDP-25 and HA-Bag1 or pcDNA3. Right panel: quantification of green fluorescence per cell (***p < 0.001 vs pcDNA3). Left panel: quantification of aggregates per cell. Small aggregates: dots composed of less than 1,000,000 pixels (***p < 0.001 vs pcDNA3). Big aggregates: dots composed of more than 1,000,000 pixels (**p < 0.01 vs pcDNA3). (f) Microscope analysis of C2C12 transiently co-transfected with GFP-TDP-25 and HA-Bag1 or pcDNA3. Right panel: quantification of green fluorescence per cell (**p < 0.01 vs pcDNA3). Left panel: quantification of aggregates per cell. Small aggregates: dots composed of less than 1,000,000 pixels. Big aggregates: dots composed of more than 1,000,000 pixels (*p < 0.05 vs pcDNA3). Full-length blots/gels are presented in Supplementary Figure S8.

