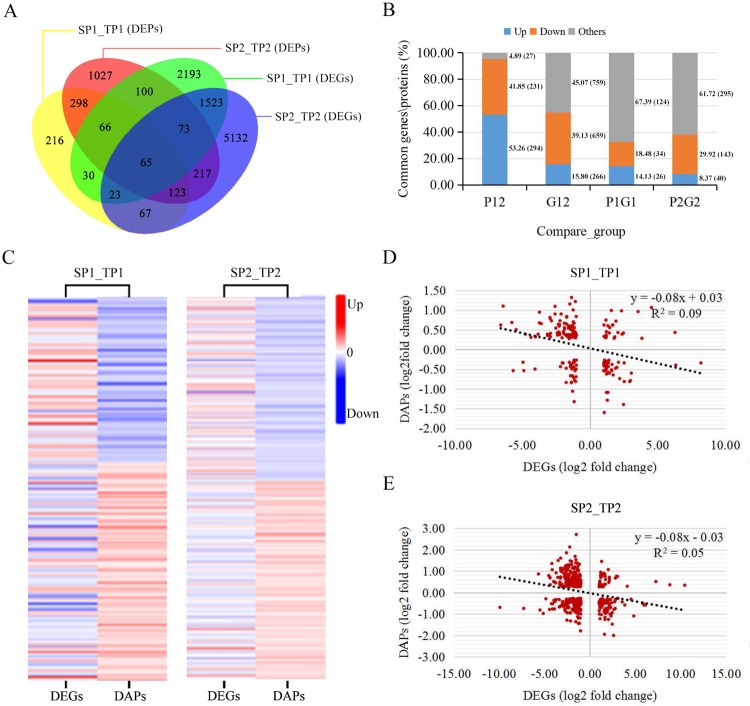
Figure 2.
Protein abundance and gene expression levels in different comparisons. (A) Venn diagram of proteins and genes. (B) Changes in the common DAPs and DEGs between groups. P12: common DAPs between SP1_TP1 and SP2_TP2; G12: common DEGs between SP1_TP1 and SP2_TP2; P1G1: SP1_TP1 genes in which associated transcript level and protein abundance exhibited opposite trends; P2G2: SP2_TP2 genes in which associated transcript level and protein abundance exhibited opposite trends. (C) Comparison of changes in transcript and protein levels of DEGs and DAPs. (D) Correlations between transcript levels and protein abundance of DEGs and DAPs in SP1_TP1. (E) Correlations between transcript levels and protein abundance of DEGs and DAPs in SP2_TP2.

