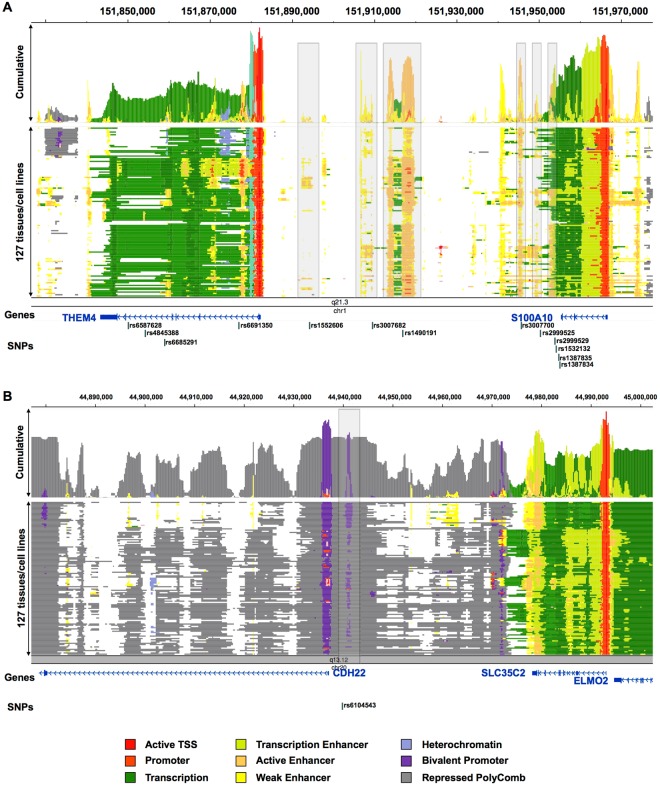
Figure 2.
The state model of chromatin in 1q21.3 (A) and 20q13.12 (B). The chromatin was segmented into 25 states (i.e., promoter, enhancer) with the ChromHMM and ChromImpute algorithms45,46 by using data from the NIH Roadmap Epigenomics Consortium (http://www.roadmapepigenomics.org) and was visualized with the WashU Epigenome Browser (http://epigenomegateway.wustl.edu/browser/). Here, 25 states are summarized to 9 as shown in the color legend. The gray shaded stripe represents an active/weak enhancer (A) or bivalent promoter regions (B).

