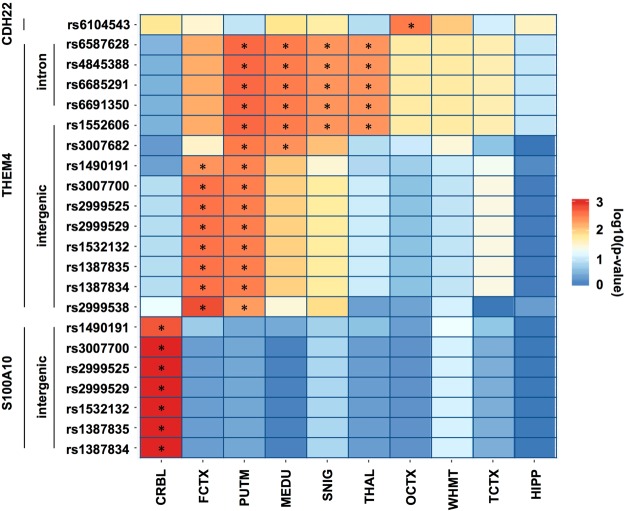
Figure 3.
Heatmap based on statistics from the eQTL analysis. Each color represents the significance (log10 (p-value)) of the association between the genotype of a SNP and the expression level of the gene that is shown for each line. P-values were provided by the BRAINEAC database (http://www.braineac.org/). An asterisk indicates that a SNP satisfies a significance threshold for the Bonferroni correction (0.05/10 brain regions = 0.005) in a brain region. This plot displays only significant eQTL associations in at least one brain region. CRBL, cerebellar cortex; FCTX, frontal cortex; PUTM, putamen; MEDU, medulla; SNIG, substantia nigra; THAL, thalamus; OCTX, occipital cortex; WHMT, intralobular white matter; TCTX, temporal cortex; HIPP, hippocampus.

