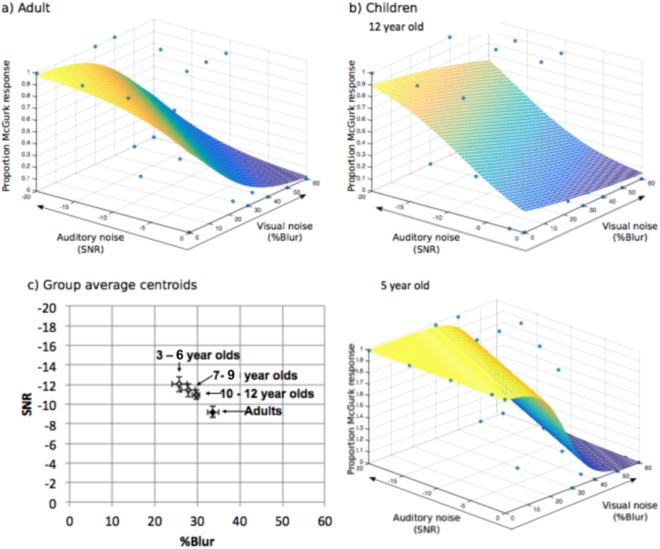
Figure 6.
Example psychometric planes fitted for (a) a single adult and (b) two child participants (aged 12 and 5). The threshold was taken as the centroid co-ordinate of points crossing the 50% threshold for McGurk responses. The average centroid co-ordinates for children and adults are shown in (c). Error bars indicate standard error of the mean. There was a significant difference in centroids between groups; adults required more visual noise to prevent McGurk responses and less auditory noise to induce McGurk responses compared with children (i.e. children showed correct auditory responses even in lower levels of visual noise and higher levels of auditory noise compared with adults).

