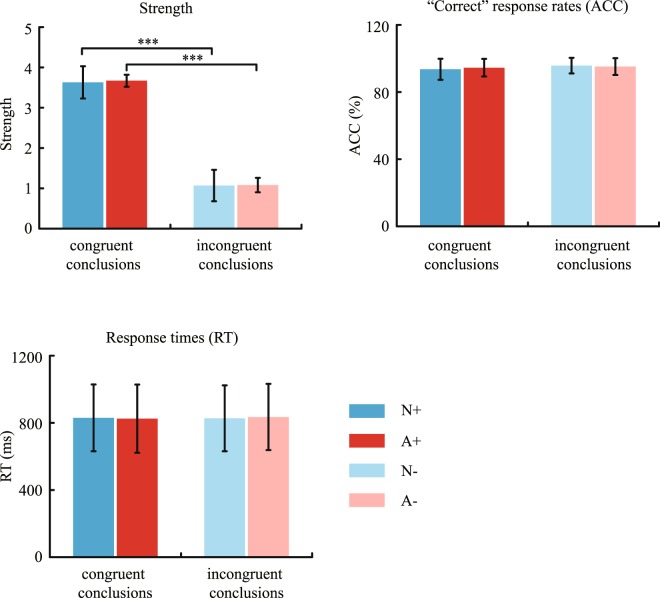
Figure 3.
The averaged inference strength, “correct” response rates (ACC), and reaction times (RTs) of “correct” responses for each sub-condition. N+ indicates “congruent conclusions with a natural premise category”; A+ indicates “congruent conclusions with an artificial premise category”; N− indicates “incongruent conclusions with a natural premise category”; A− indicates “incongruent conclusions with an artificial premise category”. Error bars represent mean ± s.e.m. ***p < 0.001.

