
Figure 3.
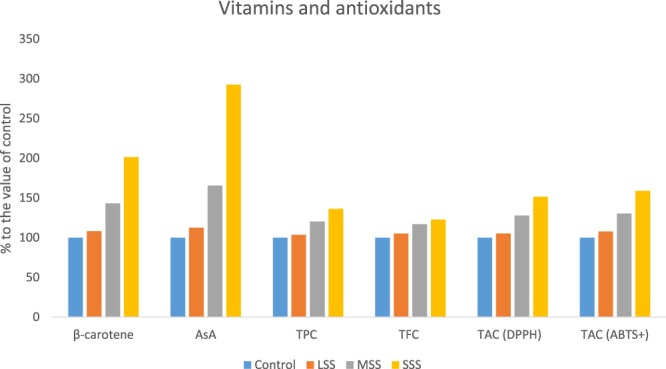
Response to vitamins, TPC, TFC and TAC, (% to the value of control) under four salinity levels: Control (No saline water), LSS (Low salinity stress), MSS (Moderate salinity stress) and SSS (Severe salinity stress) in selected A. tricolor genotype; β-carotene (mg g−1), AsA, Vitamin C (mg 100 g−1); TPC, Total polyphenol content (GAE µg g−1 dw); TFC. Total flavonoid content (RE µg g−1 dw); TAC (DPPH), Total antioxidant capacity (DPPH) (TEAC µg g−1 dw); TAC (ABTS+), Total antioxidant capacity (ABTS+) (TEAC µg g−1 dw).