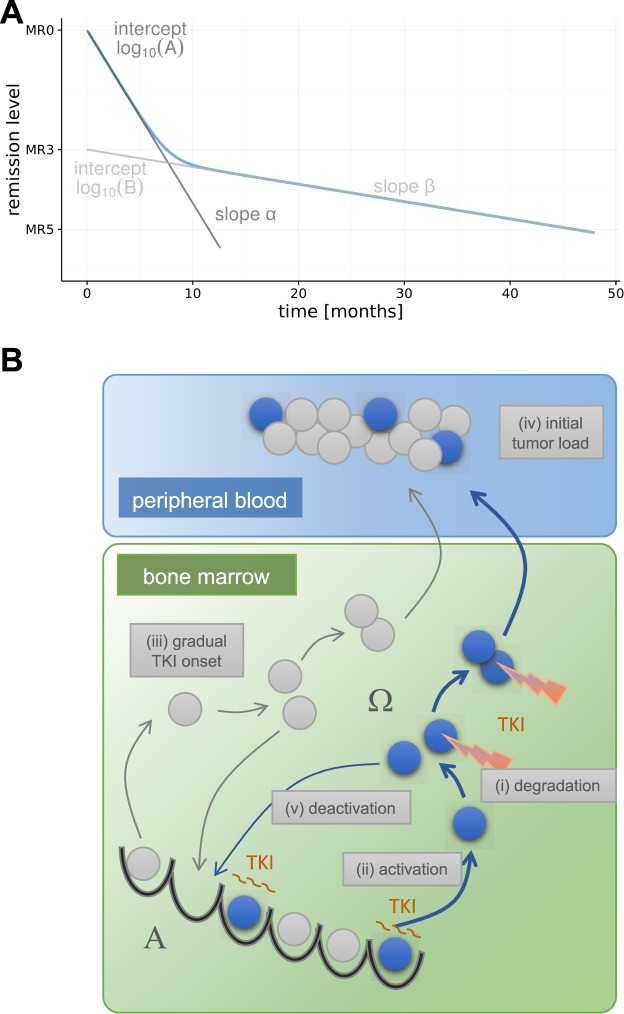
Figure 2.
Statistical und mechanistic model. (A) Bi-exponential model for the description of time course data, parameterized by the intercepts A, B, and the initial slope α and the secondary slope β. (B) Model setup of the mechanistic, single-cell based clonal competition model of CML pathogenesis and treatment. Leukemic cells are shown in blue, normal cells in grey. Both cell types change between a state of proliferative inactivity (A) and a proliferative state (Ω) before cells differentiate into peripheral blood. TKI activity is indicated by the cytotoxic effect and the prolonged quiescence of leukemic stem cell in state A. The five parameters modified for the simulation screen are identified by roman numerals (i)–(v).

