Figure 4.
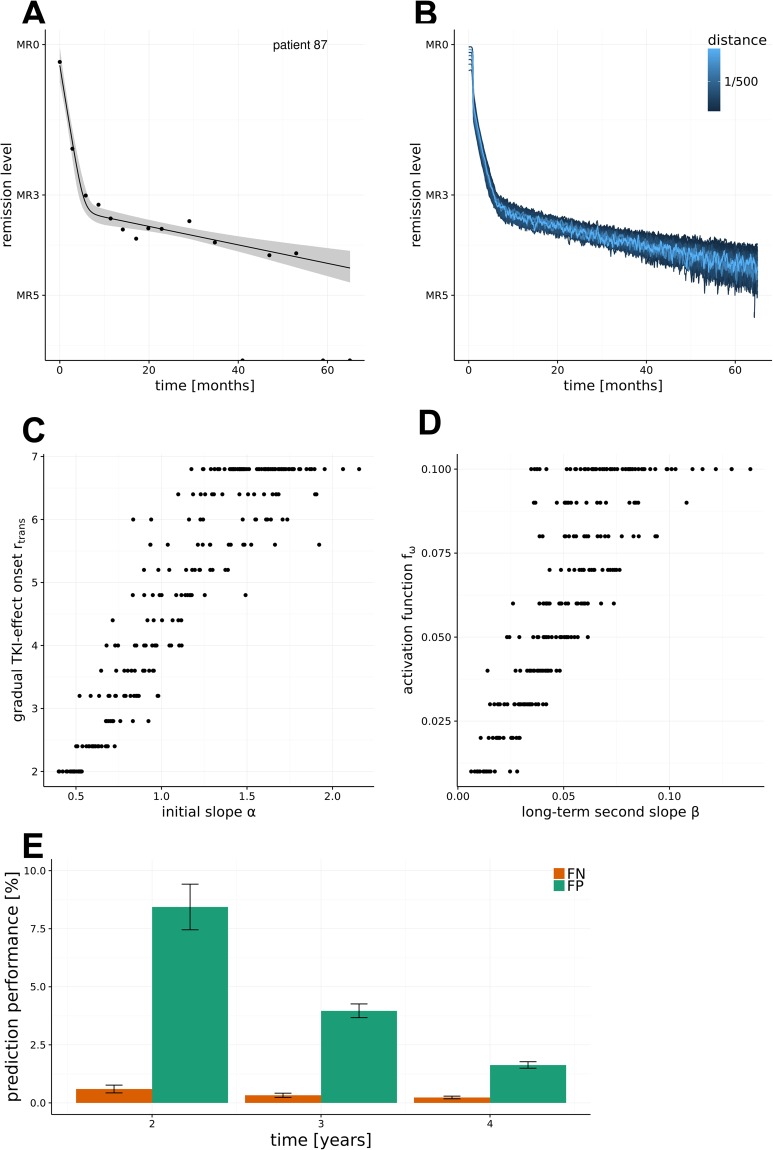
Estimation of model parameters and prediction accuracy. (A) The optimal fit of the bi-exponential regression model is shown along with a point-wise confidence interval for one patient i. (B) Identification of all parameter configurations , for which the bi-exponential fit of the resulting model simulation is contained within the confidence region of the patient’s kinetic. (C) Scatter plot relating the initial slope α of each patient’s response with the rate of gradual TKI-effect onset (rtrans) obtained for the most suitable model simulation . (D) Scatter plot relating the long-term decline β of each patient’s response with the specific activation rate of the residual LSC ( obtained for the most suitable model simulation . (E) False positives (FP) and false negatives (FN) rates for predictions of 5 year outcomes as a function of shorter observation periods (n = 234).

