Figure 3.
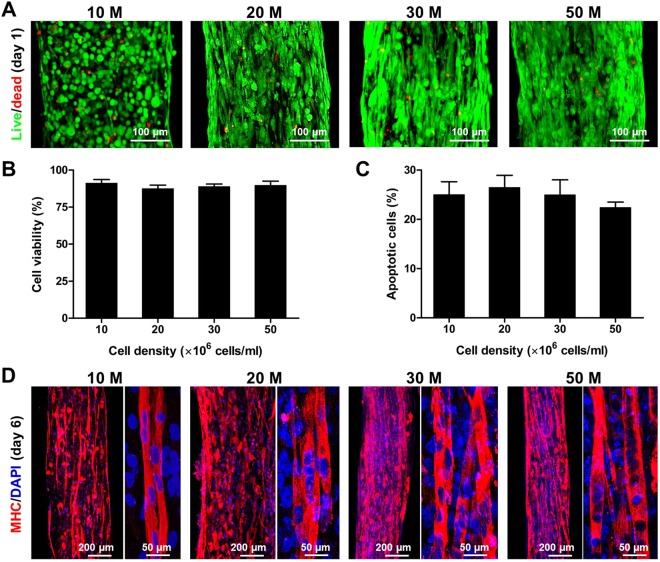
In vitro cell density optimization. (A) Live/dead staining images and (B) quantification of bioprinted muscle constructs with cell densities of 10, 20, 30, and 50 × 106 cells/ml at 1 day in culture (n = 6, 5 random fields/sample, no significant difference). (C) TUNEL assay of bioprinted muscle constructs after 6 days in culture. Apoptotic cells were calculated with different cell densities (n = 3, 5 random fields/sample, no significant difference). (D) MHC immunofluorescent images of bioprinted muscle constructs at 6 days in culture (after 5-day differentiation). Representative immunofluorescent images for MHC (red) showed that bioprinted hMPCs in the constructs with different cell densities were formed into longitudinally aligned myofibers.

