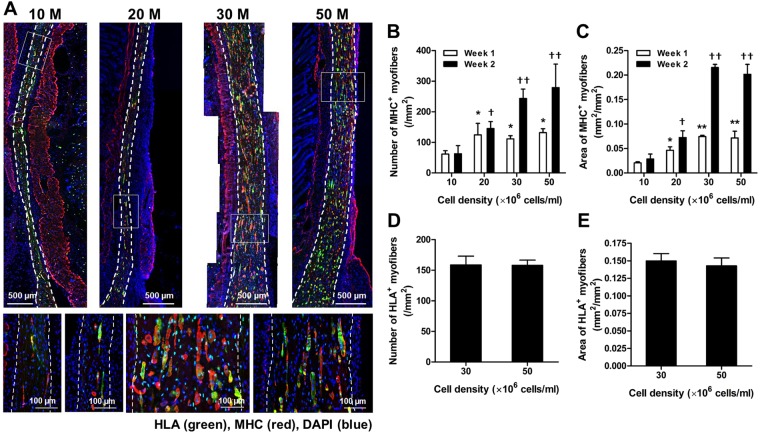
Figure 5.
Ectopic skeletal muscle regeneration. (A) Representative immunofluorescent images for MHC (red)/HLA (green) at 2 weeks after implantation. Double-immunostained MHC+/HLA+ myofibers in bioprinted constructs indicate newly formed skeletal muscle. (B) Numbers of MHC+ myofibers and (C) areas of MHC+ myofibers (n = 4, 3 random regions/sample). There is an increasing trend of skeletal muscle tissue formation with increasing cell density, but no significant difference between 30 and 50 × 106 cells/ml at 1 week and 2 weeks after implantation (*P < 0.05 compared with 10 × 106 cells/ml at 1 week, **P < 0.05 compared with 10 and 20 × 106 cells/ml at 1 week, †P < 0.05 compared with 10 × 106 cells/ml at 2 weeks, and ††P < 0.05 compared with 10 and 20 × 106 cells/ml at 2 weeks). (D) Numbers of HLA + myofibers and (E) areas of HLA+ myofibers (n = 4, 3 random regions/sample). There is no significant difference between 30 × 106 cells/ml and 50 × 106 cells/ml at 2 weeks after implantation.

