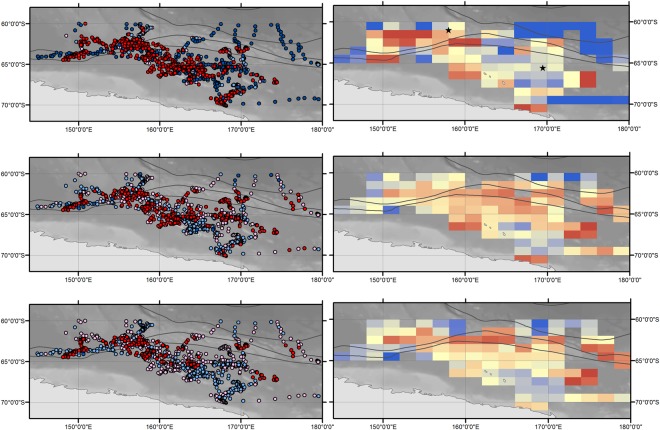
Figure 4.
Maps showing whale behavioural state estimates. (a) Behavioural state estimates from the hierarchical state-space switching model. Panel focusses on the area of most concentrated search behaviour between 145–175 °E. Predicted probabilities of being in search behaviour obtained from (b) the GAMM using environmental predictors, and (c) averaging the GAMM predictions (n = 100) across the resampling procedure (see Methods). Colours represent the gradient from transit (P < 0.25, dark blue) through to search (P > 0.75, red) at 0.25 intervals. Right hand panels: (d,e and f) spatially aggregate these probabilities into 1° latitude ×2° longitude grid cells by averaging across individual whales. Higher mean probabilities of search behaviour shown as warmer colours. The star symbols in (d) represent areas of persistent use between tracking years. Background shading indicates bathymetry derived from the GEBCO Digital Atlas103.

