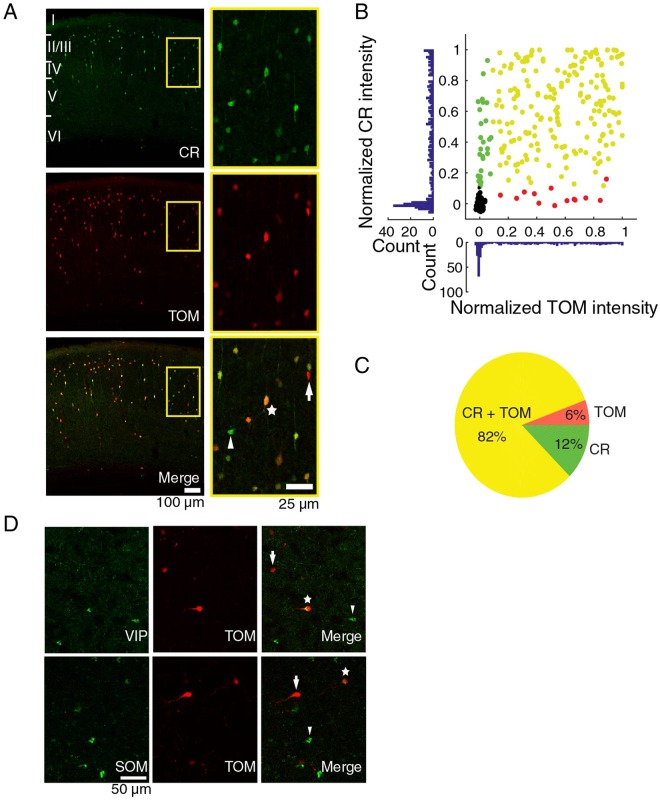
Figure 1.
Colocalization of fluorescent label with calretinin. (A) Left panels: calretinin (CR) immunoreactive cells (green) and tdTomato (TOM) expressing cells (red) in a coronal slice of visual cortex of a CR-Cre mouse injected with cre-dependent tdTomato virus. Right panels: magnification of left panels. In the lower panel, a TOM−/CR+ cell (arrow head), TOM+/CR+ cell (star), TOM+/CR− cell (arrow). (B) Normalized intensities for CR staining and TOM expression. Cells expressing only CR are green, cells expressing only TOM are red, cells expressing both are yellow, and background samples are black. (C) Pie chart of the colocalization between CR immunoreactivity and TOM expression. The percentages are of the total number of cells that had TOM and/or CR label. (D) Colocalization of TdTomato with VIP and SOM. Higher panel: VIP immunostaining on a coronal slice of a CR-cre mouse injected with a cre-dependent tdTomato virus. From left to right, VIP immunoreactive cells in green, TOM+ cells in red, merge of the two showing a TOM+/VIP− cell (arrow), a TOM+/VIP+ cell (star), a VIP+/TOM− cell (arrow head). Lower panel: SOM immunostaining and colocalization with tdTomato. From left to right, SOM immunoreactive cells (green), TOM expressing cells (red), merge of the previous panels showing a TOM+/SOM- cell (arrow), a TOM+/SOM+ cell (star) and a SOM+/TOM− cell (arrow head).

