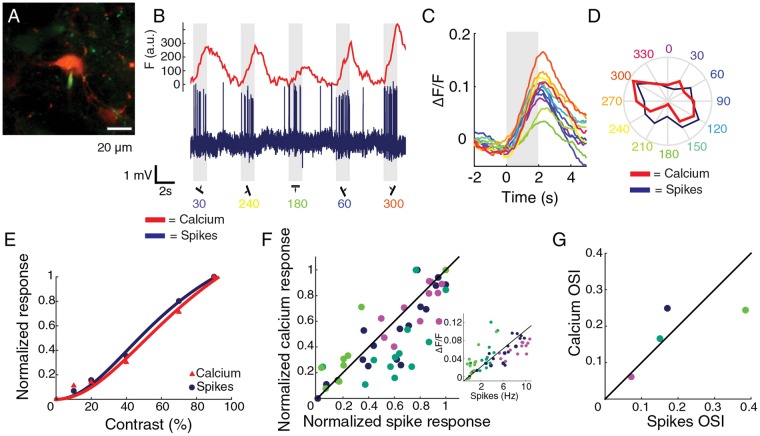
Figure 2.
Responses and selectivity measured by calcium fluorescence and cell-attached spiking. (A) Example CR+ neuron. In red tdTomato, in green GCaMP6s and dye filled cell-attached pipette. (B) Neuronal activity measured as GCaMP6s fluorescence changes (red) and electrophysiological recording (blue) from the cell in A. Grey indicates visual stimulus period. (C) Average peristimulus time calcium responses to the different directions for the cell in A. Colors correspond to directions shown in D. (D) Polar plot of the responses to the different directions in calcium fluorescence (red) and in spiking (blue) for the cell in A. (E) Example normalized responses to different grating contrasts (for cell in A). Normalization was done by dividing by the maximum response over all stimuli. (F) Correlation between normalized calcium response and normalized spiking response. Each color represents a different cell. Green represents a CR− cell, cyan, blue and magenta CR+ cells. Black line is the identity line. Inset: correlation between the non-normalized calcium response and spike rate. (G) Correlation between orientation selectivity indexes computed from calcium and spiking responses. Different colors represent different cells. Green dot represents OSI data for CR− cell, cyan, blue and magenta the OSI for CR+ cells. The identity line is drawn in black.

