Figure 3.
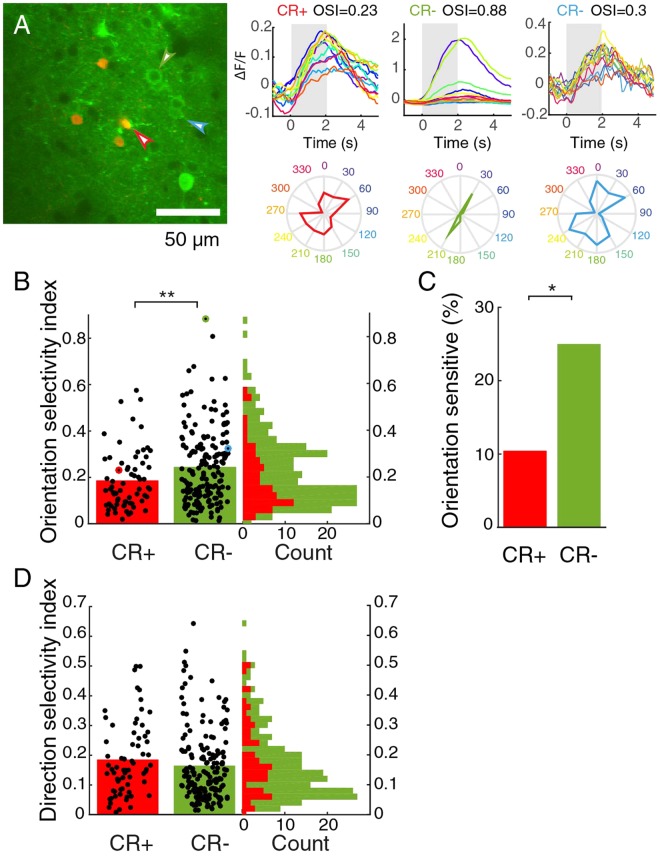
Orientation selectivity is lower in cells expressing CR. (A) Two-photon image showing the most orientation-selective CR− cell (green), an averagely tuned CR− neuron (blue) and an untuned CR+ neuron (red). On the right, average responses and polar plots for the same cells. Colors represent stimulus directions. Grey indicates stimulus period. (B) Distribution of OSI for CR+ and CR− neurons. Red and green outlined dots are the examples shown in A. Vertical bars show mean. **Indicates p < 0.01. (C) Percentage of CR+ and CR− neurons with an OSI higher than 0.33. *Indicates p < 0.05. (D) Distribution of DSI is similar for CR+ and CR− neurons. Vertical bars show mean.

