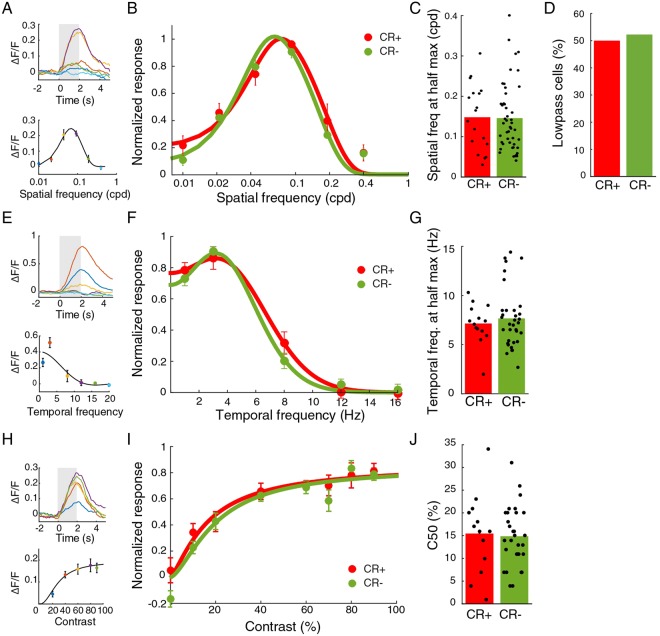
Figure 5.
Spatial and temporal frequency and contrast tuning are equal for CR+ and CR− populations. (A) Example time courses and mean responses to sinusoidal gratings of different spatial frequency. Colors represent different spatial frequencies. Error bars indicate mean and SEM. Grey indicates stimulus period. (B) Normalized responses to various spatial frequency for the CR+ and CR− populations. Responses were normalized for each cell by dividing the responses by the maximum response over all spatial frequencies. (C) Means of high spatial frequency at half max. response for CR+ and CR− neurons are equal. Bars show mean. (D) Percentages of low-pass cells for the CR+ and CR− groups are equal. (E) Example time courses and mean response to stimuli of different temporal frequencies. Colors represent temporal frequencies. (F) Temporal frequency tuning for CR+ and CR− populations are similar. Responses were normalized for each cell by dividing the responses by the maximum response over all temporal frequencies. (G) Means of high temporal frequency at half max. response for CR+ and CR− neurons are equal. (H) Example time course and mean response to gratings of different contrasts. Colors represent contrasts. (I) Normalized responses to different contrasts for CR+ and CR− populations are the same. Responses were normalized for each cell by dividing the responses by the maximum response over all contrasts. (J) Mean C50 values for the CR+ and CR− populations are equal.

