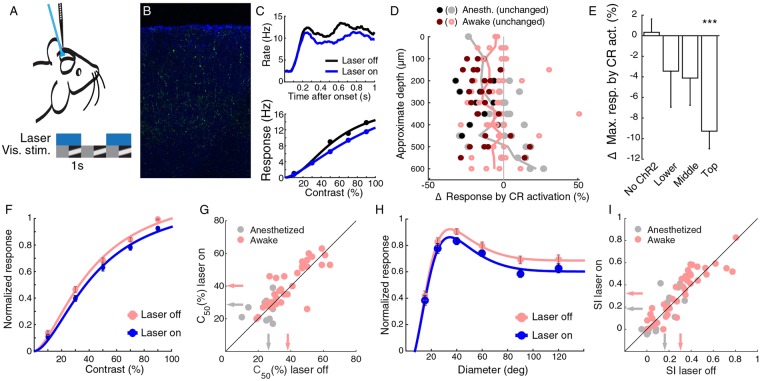
Figure 6.
Activation of CR+ cells reduces gain in anesthetized and awake mouse. (A) Activation of ChR2 transfected cells by fibre-coupled blue laser. (B) Example transfection of ChR2-YFP (green) in DAPI (blue) stained slice of V1. (C) Example contrast tuning and spike histogram of cell showing decreased responses when laser is turned on. (D) Change in mean responses for contrast tuning curve test for cells when activating CR+ cells for cells in awake (red/pink) and anesthetized (blank/grey) mice plotted versus approximate depth, measured from the top channel in the brain. Dark markers show cells that were significantly modulated (Friedman test), lines show averages per depth. (E) Most effect of CR+ activation on mean maximum responses occurs in top layers (awake and anesthetized combined). (F) Population contrast tuning curve in top layers with and without CR+ activation in awake mice. Responses were normalized for each cell by dividing the responses by the maximum response over all contrasts for the condition when the laser was off. (G) C50 in top layers is changed only little by CR+ activation in awake and anesthetized mice. Arrows indicate means. (H) Population size tuning curve in top layers with and without CR+ activation in awake mice. (I) Surround suppression in top layers is unchanged by CR+ activation. Arrows indicate means.

