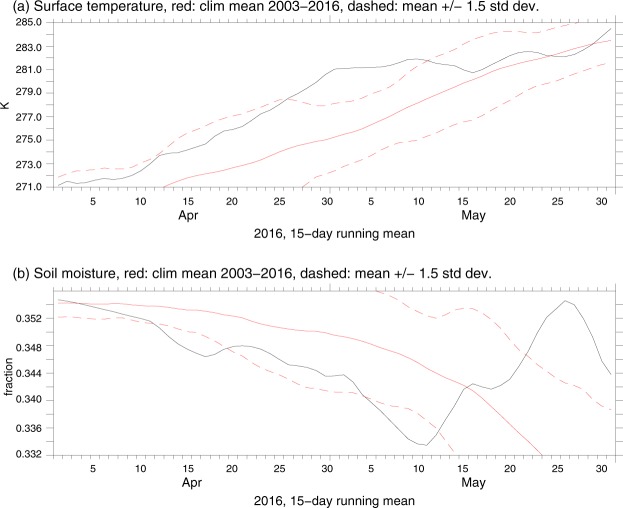
Figure 2.
15-day running mean (with central dates of corresponding 15-day intervals marked in the x axis) of the surface temperature in K (panel a) and soil moisture (non-dimensional) in the upper (0–10 cm) soil layer (panel b) over Alberta for April-May 2016 (black curves) in comparison with the 2003–2015 climatology for both variables (solid red curves in both panels), with corresponding 1.5 SD marked by dashed red curves, based on daily NCEP-NCAR reanalysis data13.

