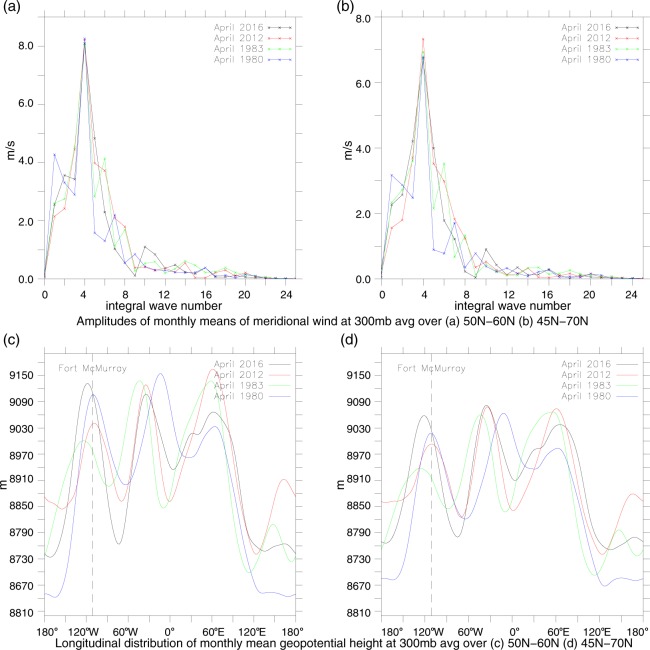
Figure 4.
The amplitudes of the Fourier components, up to n = 24, of monthly meridional velocity at 300 hPa and the longitudinal distributions of monthly H300 for Aprils of the years of 1980, 1983, 2012 and 2016, based on respective NCEP-NCAR reanalysis data13. Panels (a) and (b) demonstrate a dominance of wave-4 Fourier component over all other Fourier components of the meridional velocity averaged, respectively, over 50N–60N and 45N–70N, while panels (c) and (d) show the longitudinal distribution of H300 averaged over the same latitudinal ranges 50N–60N (c) and 45N–70N (d), with one of the maxima reached over western Canada.

