Figure 6.
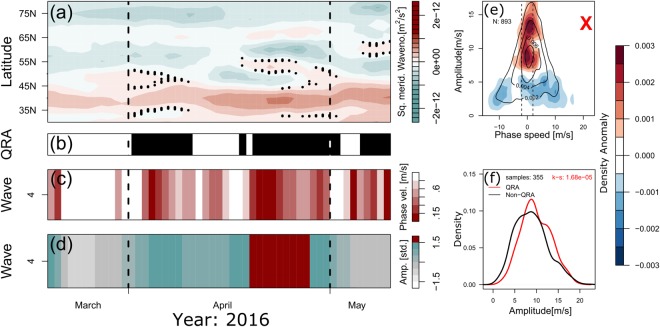
Application of the automated QRA-detection-scheme20,21 for wave-4 at 300 hPa. Panels (a–d) correspond to March-April-May (MAM) 2016 and panels (e,f)–to MAM of years 1979–2016. (a) the detected waveguides (marked by black dots) for quasi-stationary, QRA wave-4. (b) the detected duration of the QRA periods for QRA wave-4 (marked in black). (c) the QRA wave 4 phase speed (in m/s) marked in colors, with corresponding color legend in the y-axis. (d) the amplitude of QRA wave-4 in units of standard deviation marked in colors, with respective color legend in the y-axis. (e) changes in the probability density function of amplitude vs. phase speed for different wave-4 components during QRA periods as compared to the non-resonance days (red and blue filled color contours designate, respectively, positive and negative changes in amplitude, with appropriate color legend shown in the y-axis). Solid black curves in panel (e) depict corresponding 1979–2016 MAM climatology. (f) the probability density function distribution for the wave-4 amplitudes during QRA periods (red curve) vs. non-resonance days (black curve), over 1979–2016 time span. When QRA conditions are granted the quasi-stationary component of wave-4 is significantly amplified. For more details, see18,20,21.

