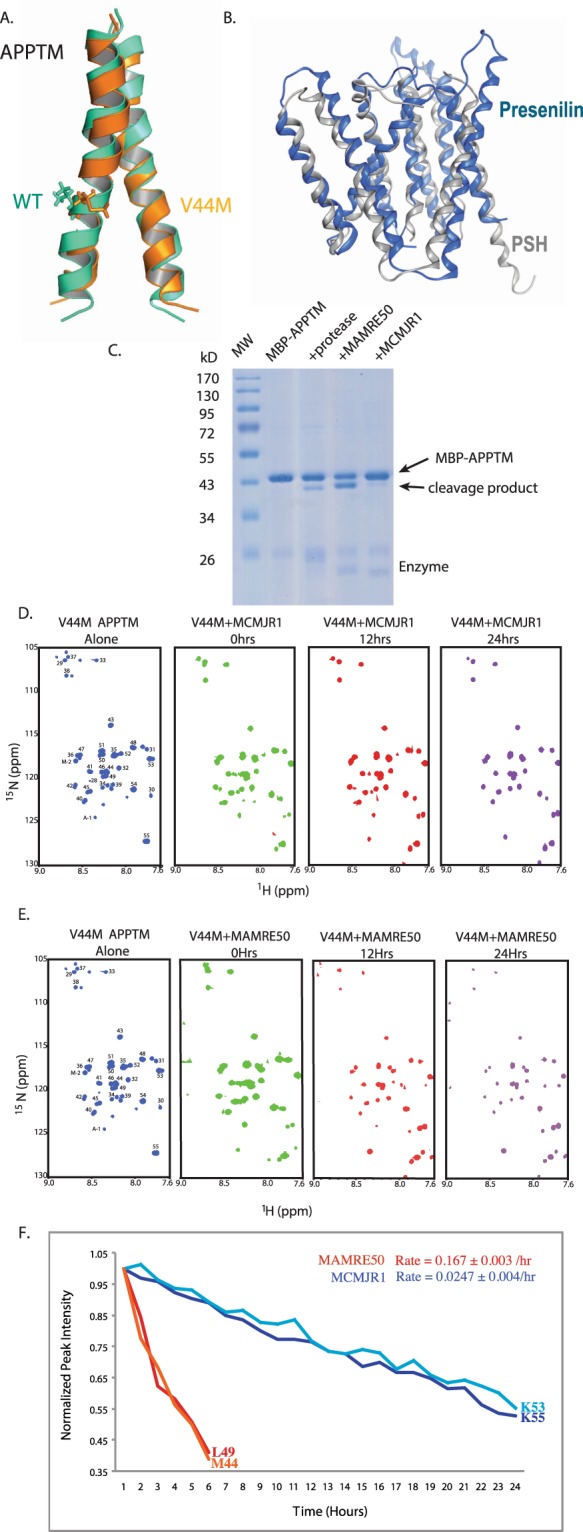
Figure 1.

Intramembrane proteolysis of APPTM in solution NMR. (A) Overlaid NMR structures of WT (green) and FAD V44M (orange) APPTM, with residue 44 in stick mode. (B) Structure of PSH (grey) overlaid on presenilin (blue) with an RMSD of 3.1 Å. (C) Intramembrane proteolysis activity of MAMRE50, MCMJR1 and a control intramembrane protease against MBP-APPTM measured by SDS-PAGE after incubation at 37 °C for 12 hrs. Intramembrane proteolysis activity of MCMJR1 (D) and MAMRE50 (E) in solution NMR, evidenced by decreasing APPTM peak intensity and the appearance of sharp peaks in 2D 15N-1H HSQC at 40 °C over 24 hours, with enzyme:substrate at 1:1 molar ratio. Similar results were obtained for WT APPTM (data not shown). (F) Determination of the cleavage rate of APPTM from variation of peak intensity over time for select well-resolved peaks with high S/N.
