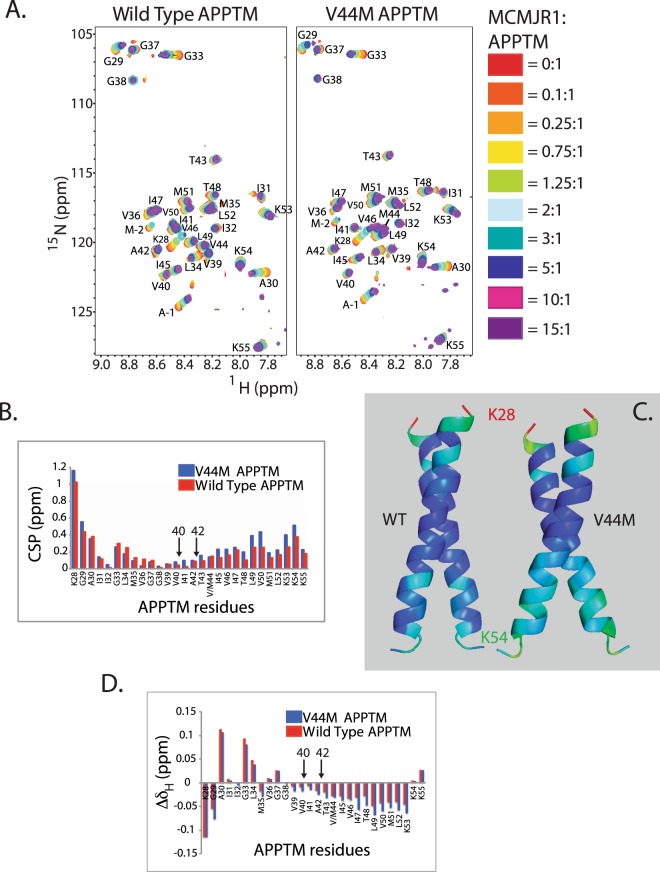
Figure 2.
Solution NMR mapping of APPTM interaction with MCMJR1. (A) MCMJR1 titration into 15N labeled WT and V44M-APPTM at enzyme:substrate molar ratios from 0:1 to 15:1. (B) Combined 15N and 1H CSP vs. residue number for WT-APPTM (red) and V44M-APPTM (blue) at an enzyme:substrate molar ratio of 10:1. The largest combined CSPs were observed at the juxtamembrane region of APPTM. V44M experienced more combined CSP than WT, especially near the C-terminus. (C) Combined CSP mapped onto the structures of WT and V44M, colored from red (largest combined CSP) to blue (smallest combined CSP) in a rainbow color gradient. (D) Amide hydrogen chemical shift perturbation (ΔδH) at 10:1 molar ratio of MCMJR1 to APPTM for both WT-APPTM (red) and V44M-APPTM (blue). The data show a pattern of decreasing amide proton chemical shift at the C-terminal half of APPTM, indicating decreasing helical hydrogen bond strength and helical unwinding in the substrate. More unwinding was observed for the FAD mutant V44M than WT. Cut sites for Aβ40 and Aβ42 generation are indicated by arrows in (B) and (D).

