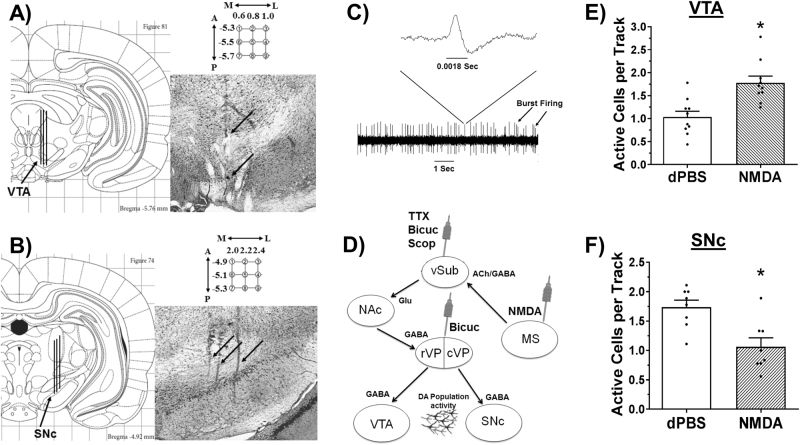
Fig. 1.
MS activation increases VTA and decreases SNc DA neuron activity: (a) Population activity in the VTA was measured in 9 sequential electrode tracks in the anatomical range depicted. Following the conclusion of the 9th track (top arrow), Chicago Sky Blue is ejected from the electrode leaving a blue dot for histological verification (bottom arrow). (b) Population activity is measured similarly in the SNc. Arrows indicate 3 tracks across the medial-lateral span of the SNc. (c) Representative DA recording and individual spike. The time bar equals 1 s, demonstrating a frequency of approximately five spikes per second. Arrows indicate two sets of spikes that are occurring in bursts. (d) Sites of pharmacological manipulation along the proposed pathway from MS to midbrain. MS-medial septum, vSub-ventral subiculum, NAc-nucleus accumbens, rVP/cVP-rostral/caudal ventral pallidum, VTA-ventral tegmental area, SNc-substantia nigra pars compacta, Bicuc-bicuculline, Scop-scopolamine. MS activation (NMDA, 0.75 µg in 0.2 µL) (e) increased the number of active DA neurons in the VTA and (f) decreased the number of active DA neurons in the SNc compared to vehicle (dPBS; *P < 0.05). Black dots indicate data from individual rats (N = 8–10 rats per group).

