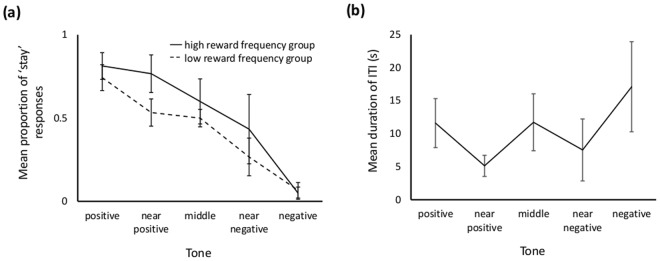
Figure 5.
(a) Mean+/− sem proportion of ‘stay’ responses made by rats to training and ambiguous tones during Experiment 2 judgement bias tests in the high reward frequency (solid line) and low reward frequency (dashed line) treatment groups. (b) Mean+/− sem duration of self-determined inter-trial intervals during Experiment 2 judgement bias tests following trials with tones of different frequencies (positive = 2 kHz; near positive = 2.8 kHz; middle = 4 kHz; near negative = 5.6 kHz; negative = 8 kHz).

