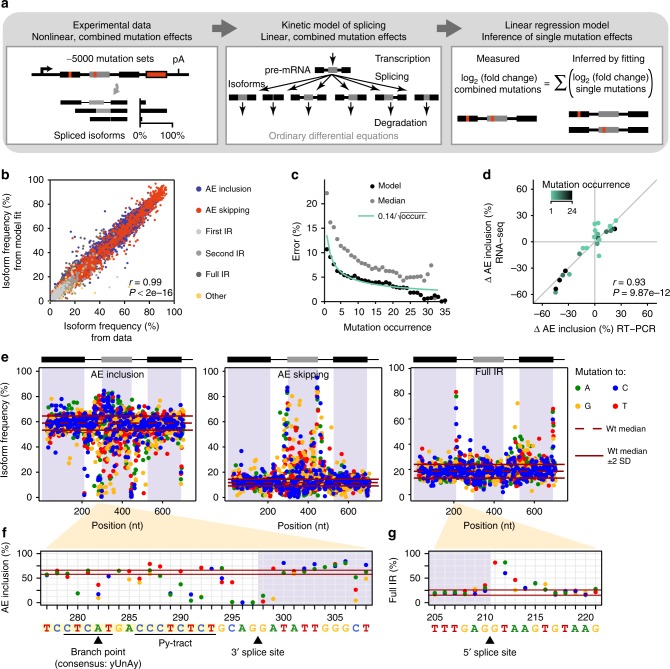
Fig. 2.
A linear regression model determines more than 1900 single mutation effects. a Model-based inference of single mutation effects. Isoform quantifications from RNA-seq for 5598 unique minigene variants, each harbouring multiple mutations, are used as input. A kinetic model of splicing reactions reveals that splice isoform ratios show linear mutation effects, irrespective of other mutations. A linear regression model is used to infer single mutation effects in a system of 5010 linear equations, one per mutated minigene variant. b Regression model describes experimental measurements with high correlation (Pearson correlation coefficient r = 0.99, P value <2e−16). Scatterplot shows frequencies of distinct splice isoforms (see legend; separately shown in Supplementary Fig. 5a) for combined mutations calculated from fitted model against one biological replicate (see Supplementary Note 2). c The model more accurately infers frequently occurring single mutation effects. Cross-validation by separately excluding single-mutation minigenes (and permutations of other minigenes containing this mutation). Inference is expressed as standard deviation of inference error in AE inclusion (y-axis) and analysed for different permutations containing mutation at different frequencies (x-axis). Inference power of model (black dots) matches theoretical expectation (green line) and outperforms median-based estimation (grey dots; see Supplementary Note 2). d Experimental validation of model-inferred single mutation effects. Semiquantitative RT-PCR measurements of AE inclusion (other isoforms in Supplementary Fig. 4b) for targeted single-mutation minigenes that were not used for model fitting. Discrepancies between model and data appear if mutation infrequently occurs in the library (colour-coded). r, Pearson correlation coefficient and associated P value. e Model-inferred landscapes of 1747 single mutation effects on AE inclusion, AE skipping and full IR in HEK293T cells. Each mutation effect is indicated as a coloured dot (inserted nucleobase, see legend). Red lines indicate median (dashed) ± 2 standard deviations (SD; solid) for wt minigenes. f, g Zoom-in landscapes of single mutation effects on AE inclusion around 3′ splice site of RON exon 11 (f) and on full IR around 5′ splice site of constitutive exon 10 (g). Black lines and arrowheads mark splicing signals, including branch point, polypyrimindine tract (Py-tract) and splice sites. Visualisation as in e

