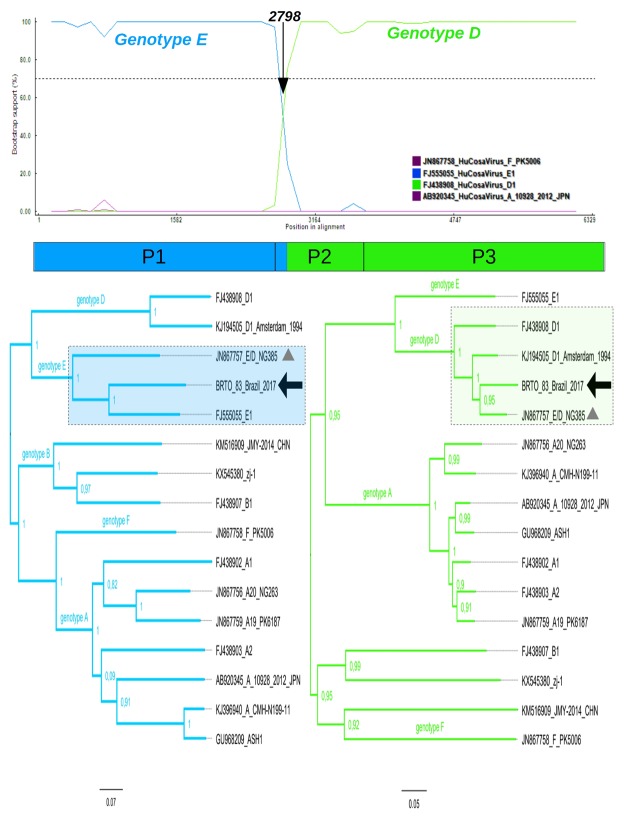
Figure 2.
Recombination pattern of the Brazilian isolate BRTO-83. Colored lines represent the probability (given in bootstrap value) that genomic regions belong to a certain parental genotype. The x-axis represents the sequence length in base pairs (bp). The y-axis represents the statistical support (bootstrap) based on 500 replicates. Each plotted line refers to a certain genotype (see the code color on the small panel). A vertical arrow indicates the recombination break point on the genome region. The plot indicates a single breakpoint in the polyprotein region of the isolate BRTO-83 at the position 2798. This breakpoint corresponds to the initial part of the Cosavirus protein P1 (see diagram below the recombination plot). Strains used as parental references are also shown in the recombination plot. Trees were constructed using the partitioned genome. The first partition tree (nucleotides; 1–2798) demonstrates the isolate BRTO-83 clustering with genotype E (left tree), and the second tree (nucleotides 2799–6269) demonstates the isolate BRTO-83 within the clade formed by genotype D strains (right tree). Genotype reference strains are indicated by filled dots on the genome tree. The recombinant strain NG385 is indicated by gray triangles in the trees. Analyses were performed using a neighbor-joining method and a Kimura 2 parameters model in windows of 250 bp sliding along sequences in increments of 40 bp. For parental references, non-recombinant sequences were used. The boostscan plot was obtained by analysis performed using RDP v.4 software.

