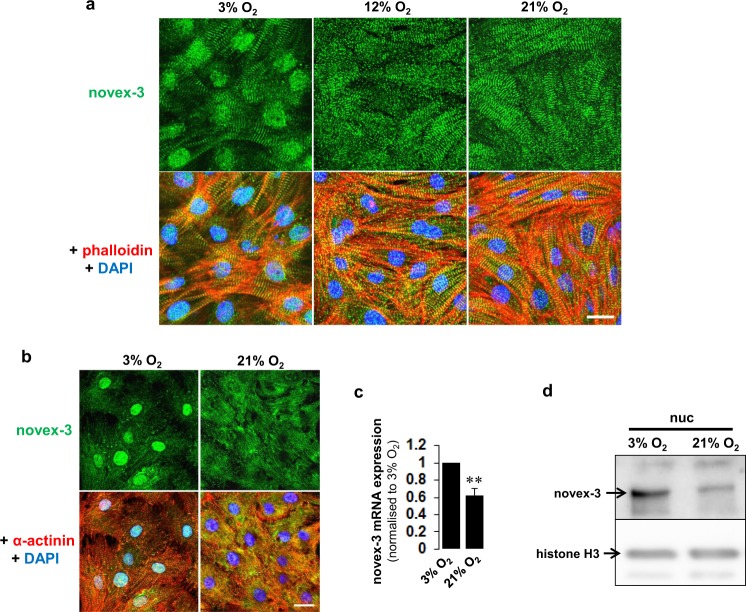
Figure 4.
Nuclear expression of novex-3 in hypoxic fCMs is repressed by exposure to higher O2. (a) Immunofluorescence staining for novex-3 (green) observed in phalloidin (red) and DAPI (blue) in E17 fCMs cultured under different O2 conditions. Scale bar = 20 µm. (b) Immunofluorescence staining for novex-3 (green, another e2 antibody was used; see Methods) observed in sarcomeric α-actinin (red, as a CM marker) and DAPI (blue) in E17 fCMs cultured under different O2 conditions. Scale bar = 20 µm. (c) qPCR analysis of novex-3 mRNA expression in fCMs cultured under different O2 conditions. n = 3 independent experiments. **P < 0.01 compared to 3% O2. Error bar = SEM. (d) Immunoblot analysis for novex-3 protein in nuclear fraction from E17 fCMs cultured under different O2 conditions. Histone H3 was included as a loading control.

