Figure 7.
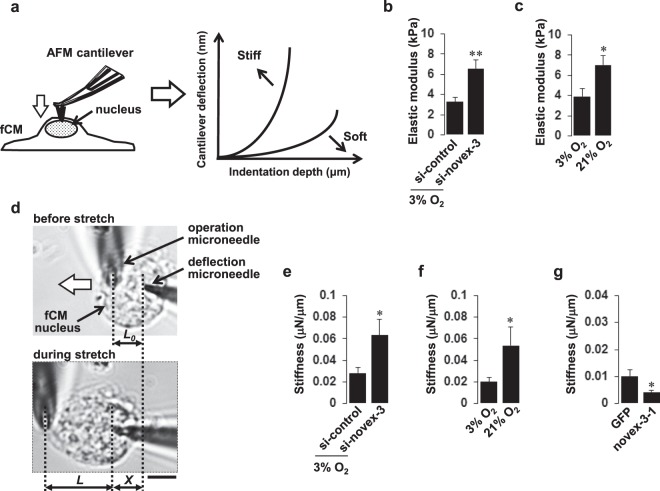
Novex-3 plays a role in providing the elasticity/compliance to the fCM nuclei. (a) Mechanical indentation measurements by atomic force microscopy (AFM). Intrusion of the AFM cantilever onto the surface of the fCM generated a force-indentation curve, which is the relationship between the cantilever deflection and its indentation depth. The elastic modulus (E) was calculated based on the Hertz model (see Methods). Measurements were performed on the central region of the nuclei, as monitored by phase contract optics as previously described26–28. (b) The elastic modulus of novex-3-silenced E16 fCMs evaluated on the central region of the nuclei. fCMs were cultured under 3% O2 condition. n = 6–8 fCMs. **P < 0.01 compared to si-control. Error bars = SEM. (c) The elastic modulus of E17 fCMs cultured under different O2 conditions evaluated on the central region of the nuclei. n = 6–7 fCMs. *P < 0.05 compared to 3% O2 condition. Error bars = SEM. (d) Microneedle-based tensile tests. One microneedle, designated as an operation microneedle, was rigid and was moved with a three-axis motorised micromanipulator to stretch the nucleus. The other microneedle, designated as a deflection microneedle, was flexible, to obtain the force applied to the nucleus by measuring its deflection. A single isolated fCM nucleus was captured by putting the microneedle tips into the nucleus. The nucleus was then lifted off the chamber bottom and stretched horizontally at a rate of 1 μm/s by moving the operation microneedle along the surface of the chamber bottom. The stiffness was calculated from the slope of the force-deformation curve. L, the distance between the tips of the two microneedles along the axis of stretch (L0, the initial distance before stretch). X, the deflection of the deflection microneedle. Scale bar = 5 µm. (e) Stiffness of novex-3-silenced fCM nuclei isolated from E17–E18 fCMs cultured under 3% O2 condition. n = 6–13 nuclei. *P < 0.05 compared to si-control. Error bars = SEM. (f) Stiffness of fCM nuclei isolated from E17–E18 fCMs cultured under different O2 conditions. n = 6–9 nuclei. *P < 0.05 compared to 3% O2 condition. Error bars = SEM. (g) Stiffness of novex-3–1-overexpressing fCM nuclei isolated from E17 fCMs cultured under 3% O2 condition. n = 7–9 nuclei. *P < 0.05 compared to control GFP-overexpressing fCM nuclei. Error bars = SEM.

