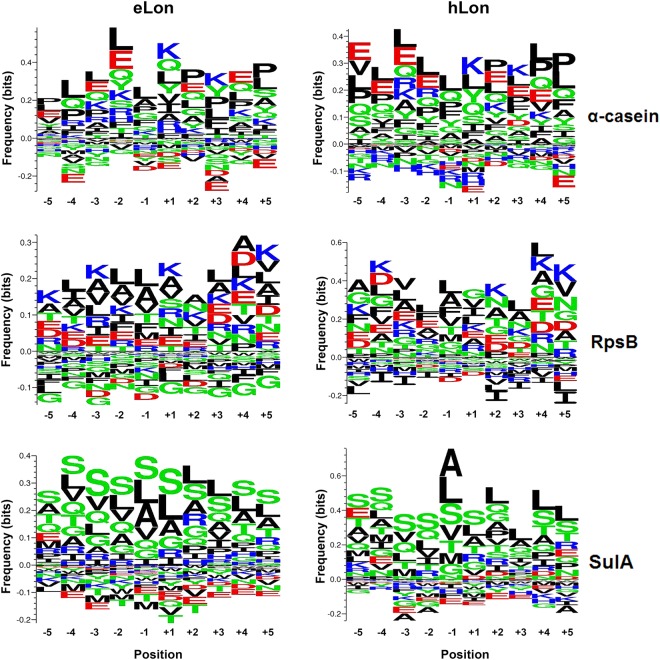
Fig. 6. Web-based Seq2logo representation of amino-acid frequency at the Lon cleavage sites.
The frequencies of the 10 amino acids (AAs) preceding (position −1) and following (position +1) all cleavage sites within α-casein, RpsB, and SulA were calculated as exemplified in Fig. S7B. The small and large sizes of the letters in each position represent relatively low and high frequencies of the corresponding amino acids, respectively. The AAs are presented as nonpolar and aliphatic group (black), polar and uncharged group (green), positively charged group (blue), or negatively charged group (red)

