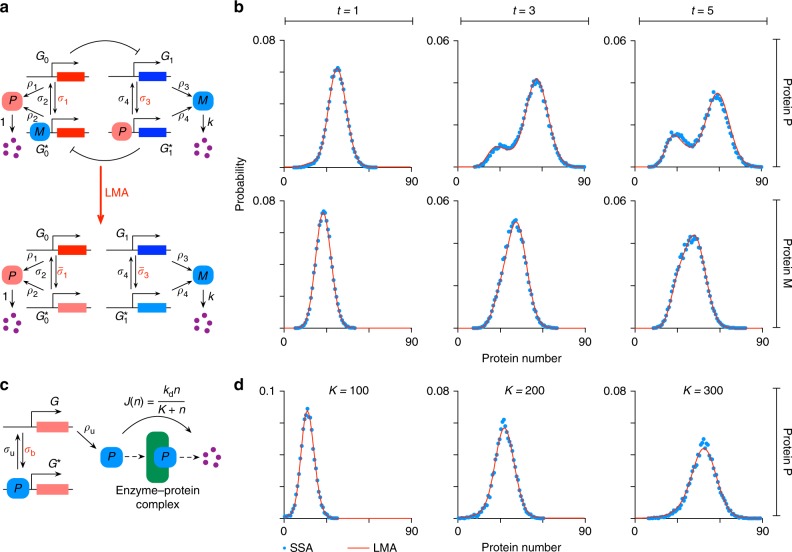
Fig. 5.
LMA for the toggle switch and for a feedback loop with nonlinear protein degradation. a (upper panel) Illustrates a toggle switch (with two active and two inactive promoters), whereby two proteins P and M are expressed and mutually repress each other. (lower panel) illustrates how the toggle switch system is decoupled by the LMA into two independent linear networks. b Shows the LMA predictions for time-evolution of the marginal distributions of the two proteins, P and M, in the toggle switch for three different time points. The parameters are: ρ1 = 60, ρ2 = 25, ρ3 = 45, ρ4 = 30, σ1 = σ3 = 0.004, σ2 = σ4 = 0.25 and k = 1. c Shows the feedback loop with nonlinear protein degradation via an effective Michaelis–Menten reaction. d Shows the LMA predictions for steady-state protein distributions of the system shown in c for three different values of the Michaelin–Menten constant K. The other parameters are: ρu = 3, ρb = 0, σb = 4 × 10⁻⁴, σu = 0.25 and kd = 20

