Fig. 9.
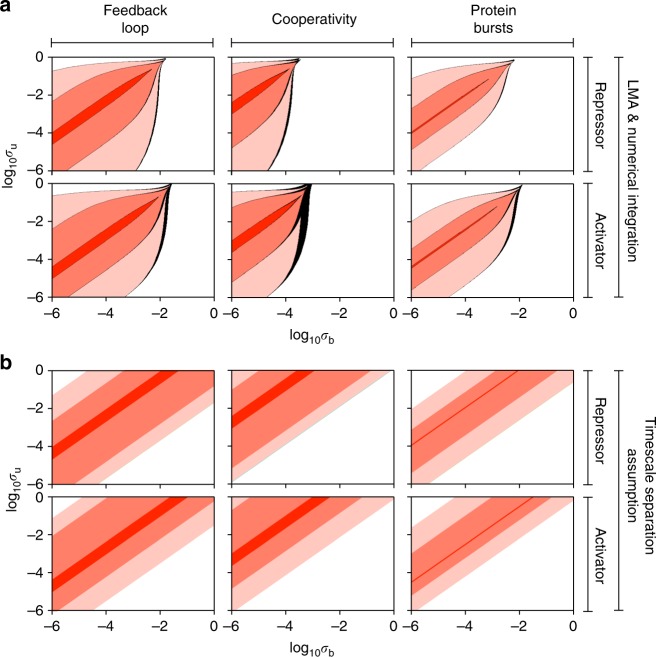
Stochastic bifurcation diagram for non-oscillatory feedback loops. a The red shaded areas denote the regions of parameter space where the steady-state distribution of protein numbers is bimodal, the white areas shows the regions where the distribution is unimodal and the black areas show regions where the LMA and direct numerical integration of the master equations disagree on the number of modes of the distribution. The black regions are small and thus verify the accuracy of the LMA. The shade of red indicates the difference between gene expression in the two promoter states, where a lighter shade indicates a larger difference. Specifically from inside to outside, the dark red corresponds to ρu = 40, ρb = 25 (repressor) and ρu = 25, ρb = 40 (activator), the medium red corresponds to ρu = 50, ρb = 25 (repressor) and ρu = 25, ρb = 50 (activator), and the light red corresponds to ρu = 60, ρb = 25 (repressor) and ρu = 25, ρb = 60 (activator). The cooperativity order was cp = 2 for the feedback loop with cooperativity and the mean protein bursts size was b = 2 for the feedback loop with bursting. Generally the region of parameter space where bimodality is present is decreased by cooperativity and by bursting but is almost unaffected by the type of feedback (activating or repressing). b This is the same as a except that the number of modes of the steady-state distribution of protein numbers is calculated using a method in the literature which assumes timescale separation, i.e. slow promoter switching12. While this method captures the salient features of the bifurcation diagrams in a it also significantly over-estimates the extent of bimodality and thus illustrates the advantage of the LMA over timescale separation methods

