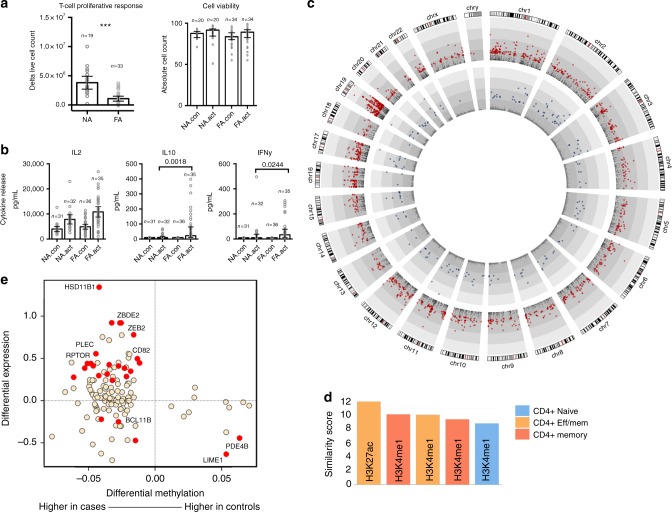
Fig. 4.
T cell hypo-responsiveness in allergic children is underpinned by altered remodeling of metabolic and inflammatory genes. a Proliferative responses and cell viability following T cell activation. Data are expressed as fold change calculated as post–pre-activation cell counts, with bars showing median and interquartile range. Groups were compared using the Mann–Whitney test. ***P < 0.001. NA.con non-allergic quiescent, NA.act non-allergic activated, FA.con food allergy quiescent, FA.act food allergy activated. b Supernatant cytokines, with data expressed as median with interquartile range. Groups were compared using the Mann–Whitney test. c Genome-wide view of the –log 10 P value for 1412 differentially expressed genes (red circles) and 189 differentially methylated CpG (blue circles). d Similarity (Forbes coefficient) between allergy-dmrs and regions marked by activating histone modifications in naive and effector/memory cells, respectively. Similarity calculated by ratio of observed/expected overlap between these regulatory regions and allergy-dmrs. e Relationship between differential methylation and gene expression. X-axis shows delta value expressed as percent methylation (10−2) for the comparison of cases–controls. Y-axis shows the log 2 fold change. Points in red were differentially methylated and expressed (remodeled genes) at the genome-wide level. Eff effector, mem memory

