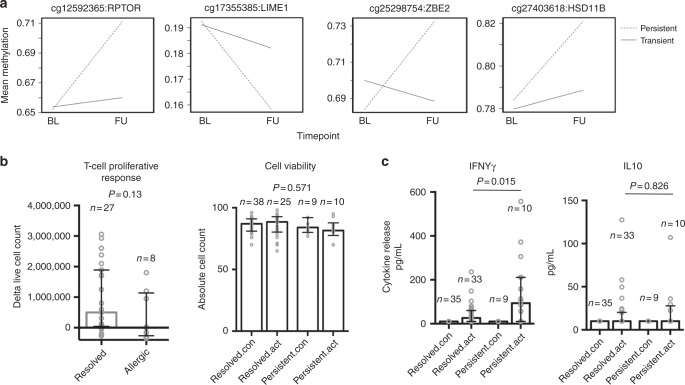
Fig. 5.
Analysis of allergy candidates at follow-up between persistent and resolved allergics. a The top panels show representative interactions plots for 4 of the 24 remodeled candidates identified at baseline. Children with persistent allergy show cumulative epigenetic perturbation with age. Filled and dashed lines represent the trajectory for the change over time in mean methylation levels (10−2). Probe Ids and gene names are shown above, and full statistics are provided in Table 4. b Proliferative responses and cell viability following T cell activation at follow-up are shown as median with interquartile range. c Cytokine production was expressed as median with interquartile range. For b and c groups were compared using the Mann–Whitney test. Exact P values are shown. For cell viability, exact P value was derived from the one-way ANOVA test

