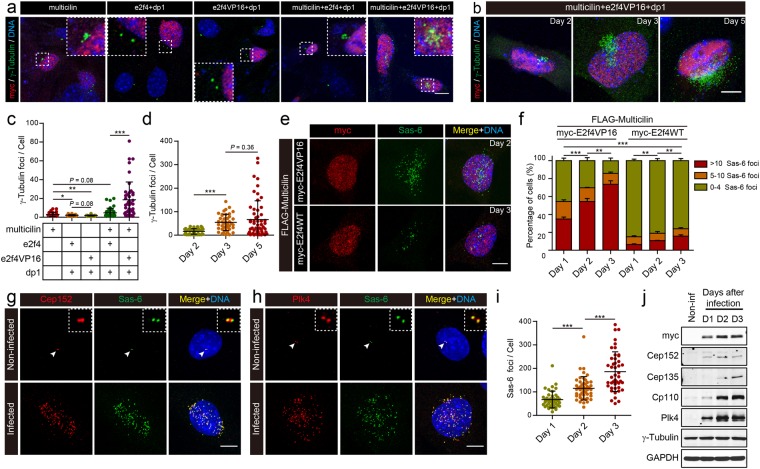
Figure 1.
Ectopic expression of multicilin and an activated form of e2f4 in MEFs drives centriole amplification. (a) MEFs were transfected as indicated with myc-tagged forms of Xenopus multicilin, wild type e2f4, e2f4VP16, and dp1, fixed 2 days post-transfection, immunostained for myc (red), γ-Tubulin (green) and DAPI (blue) and then imaged by confocal microscopy. Insets show magnified images of the centriolar staining. (b) MEF cells transfected with myc-tagged forms of multicilin, e2f4VP16, and dp1 were fixed at different days post-transfection, and imaged as in panel a. (c) γ-Tubulin foci scored in MEFs transfected with the indicated DNAs and imaged as in panel a. (d) Quantification of the experiment shown in panel b. (e) MEF cells infected with Ad5 encoding FLAG tagged Multicilin along with myc-tagged E2f4VP16 (2 days PI) or E2f4WT (3 days PI), were fixed and immunostained for the myc-tag (red), and Sas-6 (green), followed by DAPI staining (blue). (f) MEFs infected as indicated were scored based on the number of Sas-6 foci, at different days PI. (g,h) MEFs infected with an Ad5 vector encoding Multicilin/E2f4VP16 or non-infected cells in G2 as controls, were imaged by confocal microscopy 2 days PI, after staining for Cep152 (red) and Sas-6 (green) (g) or for Plk4 (red) and Sas-6 (green) (h), followed by DAPI staining (blue). (i) Total number of Sas-6 foci in MEFs expressing Multicilin/E2f4VP16 at different days PI. (j) Immunoblot analysis of the indicated proteins from non-infected cells or infected cells at different days PI. GAPDH was used as the loading control. Data that are plotted are based on triplicate experiments, where >100 cells were scored at each timepoint. Scale bars = 20 μm (a), and 10 μm (b,e,g,h). Error bars = s.d. Data were compared using a two-tailed t-test (*P < 0.05, **P < 0.01, ***P < 0.001, in this and other Figures).

