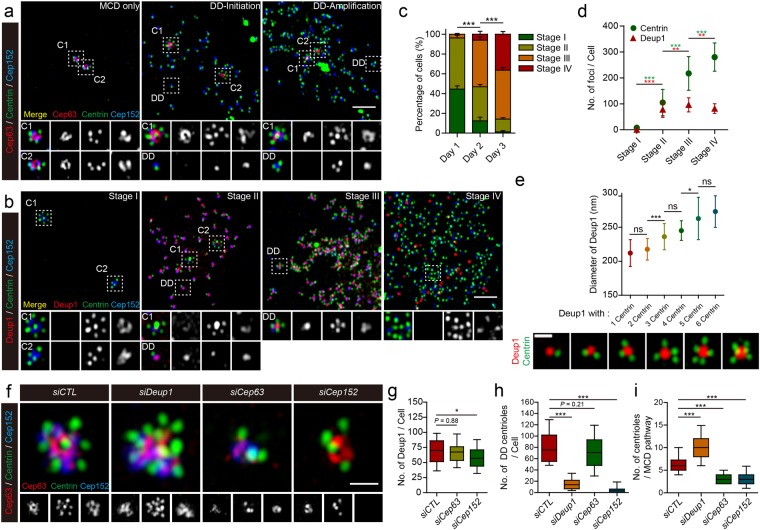
Figure 2.
Super-resolution imaging of centriole amplification in MEFs expressing Multicilin and E2f4VP16. (a) Super-resolution images of MEFs expressing Multicili/E2f4VP16 stained with Cep63 (red), Centrin (green) and Cep152 (blue). The magnified insets show details for centriole assembly on existing centrioles (C1 or C2, marked with Cep63) versus that occurring at the deuterosome (DD). (b) Super-resolution images of MEFs expressing Multicilin/E2f4VP16 stained with Deup1 (red), Centrin (green) and Cep152 (blue). The magnified insets show details for centriole assembly on existing centrioles (C1 or C2, marked with Centrin at the core) versus that occurring at the deuterosome (DD, marked with Deup1). Cells were divided into 4 stages as described in the text. (c) MEFs expressing Multicilin/E2f4VP16 were scored at different days PI in triplicate for >100 cells, using the staging of MCC differentiation described in the text. (d) Average number of Deup1 and Centrin foci in MEFs expressing Multicilin/E2f4VP16 at different stages of MCC differentiation, based on >35 cells scored at each stage. (e) Average size of Deup1 foci based on super-resolution images (Fig. S5a,b and lower panel) of Deup1 (red) and Centrin (green) antibody staining, plotted according to engaged centriole number. (f) MEFs were subjected to RNAi knock down (siCTL, siDeup1, siCep63 or siCep152) 1 day before the infection. MEFs were fixed at day 1 PI (2 days after initial siRNA transfection) then subjected to antibody staining as indicated. Representative super-resolution images of MEFs stained with Cep63 (red), Centrin (green) and Cep152 (blue) followed by cropping to show MCD specific centriole amplification. (g–i) Boxplots summarizing the effects of different gene knock downs in MEFs expressing Multicilin/myc-E2f4VP16, on the number of Deup1 foci (g), of Sas-6 foci associated with Deup1 (h), or of procentrioles, marked with Centrin, associated with the pre-existing centrioles marked with Cep63 staining (i). P-values based on a two-tailed, t-test. All other error bars = s.d. Scale bars = 2 μm (a,b) or 0.5 μm (e,f).

