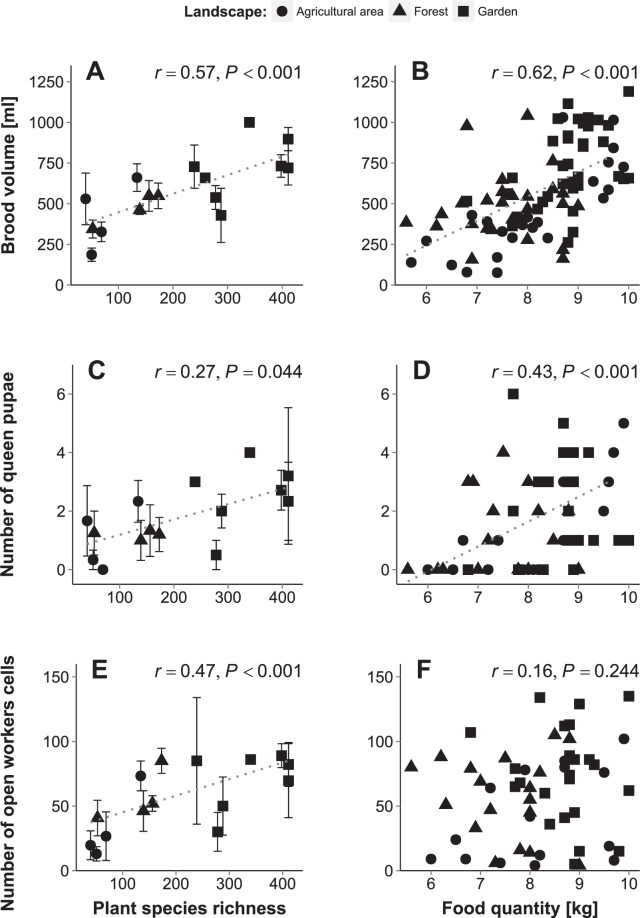
Figure 2.
Bee colony fitness parameters in relation to plant species richness within the bees’ flight radius (A,C,E) and stored food quantity (B,D,F) in different habitats (Landscape: agricultural areas (circles), forests (triangles) and gardens (squares)). Dotted lines indicate significant correlations (Spearman). Points in A,C and E display means and standard errors where several measurements could be taken of different colonies at a specific site. Both brood volume and queen production (i.e. number of queen pupae) of bee hives were best explained by plant species richness (Supplementary Table S4; brood volume: GLMM: χ2 = 20.88, df = 1, P < 0.001; queen production: χ2 = 6.82, df = 1, P = 0.009) and increased with plant species richness (A,C). Brood volume and queen production were also better explained (or tended to better explained) by stored food quantity than nutritional quality (Supplementary Table S4; brood volume: χ2 = 18.79, df = 1, P < 0.001; queen production: χ2 = 5.32, df = 1, P = 0.021) and increased with increasing stored food quantity (B,D). Daily worker production (i.e. number of open worker cells) was best explained by plant species richness interacting with habitat type (Supplementary Table S3; habitat: χ2 = 9.64, df = 4, P = 0.047, plant species richness: χ2 = 13.61, df = 3, P = 0.003, E). It generally increased with plant species richness (E), particularly in agricultural areas (r = 0.68, P = 0.005) and forests (r = 0.51, P = 0.03), but not in gardens (r = 0.19, P = 0.379). Interestingly, worker production was not affected by stored food quantity and nutritional quality, but sites and year (Supplementary Table S3; F). Note that the greater number of garden sites was due to the greater distance between paired sites which necessitated separate botanical surveys for each site.

