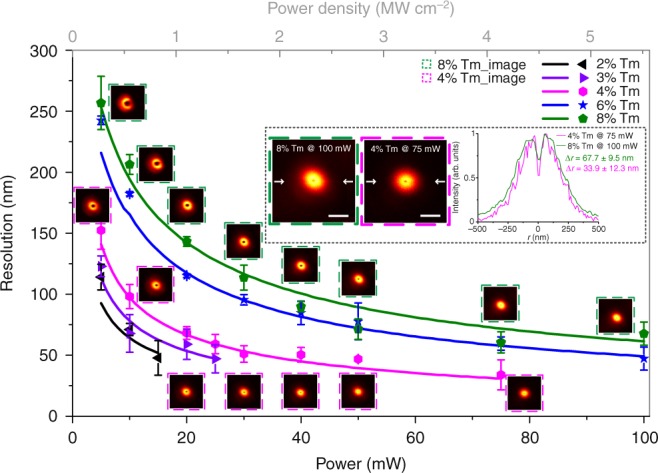
Fig. 3.

Super-resolution scaling ∆r of UCNPs as a function of the excitation power (intensity). The dots of experimental data are fitted well to the simulation results (solid lines; Supplementary Fig. 5). Error bars are defined as s.d. from line profiles of several measurements. Insets, NIRES images of 8% Tm3+ doped UCNPs at 5.5 MW cm−2 (left), 4% Tm3+ one at 4 MW cm−2 (middle), and the corresponding cross section profile lines (right). Pixel dwell time, 3 ms; pixel size, 10 nm. Scale bar is 500 nm. The series of NaYF4: 20% Yb3+, x% Tm3+ UCNPs (x = 2, 4, 6, and 8) ~40 nm in diameter are controlled synthesized and characterized by following previously reported methods19,46, and shown in Supplementary Note 4 and Supplementary Fig. 4
