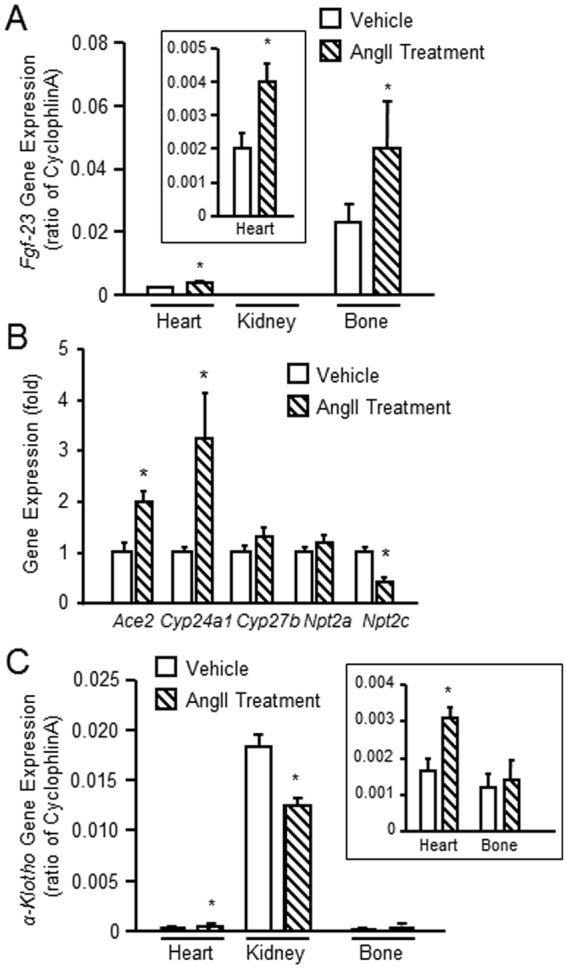
Figure 3.

Ang II induced gene expression in heart, bone and kidney. (A) Comparison of Fgf-23 message expression in heart, kidney and bone (without marrow) from Ang II or vehicle treated mice. (B) Comparison of FGF-23 message expression in the kidney from rats with/without Ang II treatment. (C) Comparison of α-Kl expression in heart, kidney and bone (without marrow) from Ang II treated with vehicle treated mice. n = 4/group, *p < 0.05 vs vehicle treated controls. All values are shown as mean ± SEM.
