
Fig. 2.
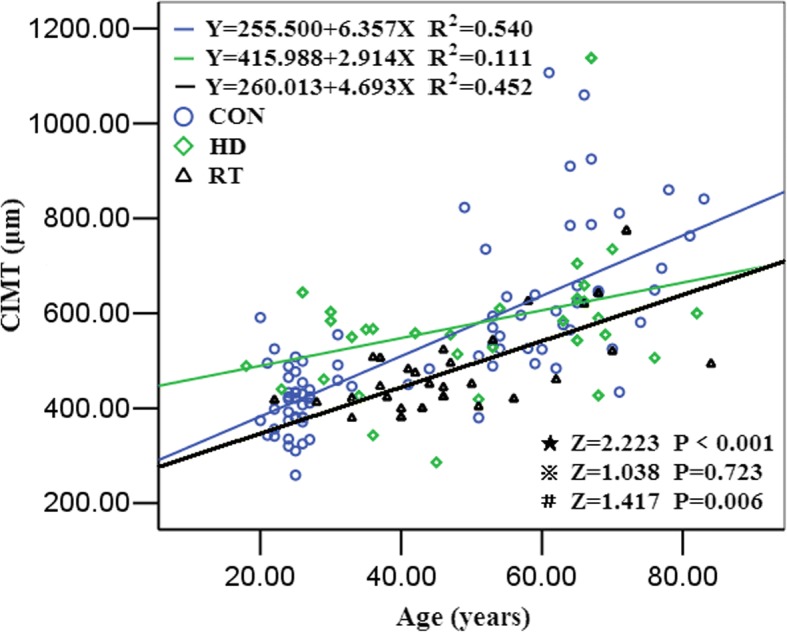
The linear regression curve of carotid intima-media thickness with age in the three groups. ⋆control group VS. hemodialysis group, ⋇hemodialysis group VS. RT group, #control group VS. RT group
Official websites use .gov
A
.gov website belongs to an official
government organization in the United States.
Secure .gov websites use HTTPS
A lock (
) or https:// means you've safely
connected to the .gov website. Share sensitive
information only on official, secure websites.
The linear regression curve of carotid intima-media thickness with age in the three groups. ⋆control group VS. hemodialysis group, ⋇hemodialysis group VS. RT group, #control group VS. RT group